On the forex front, the ICE U.S. Dollar Index slipped 0.2% on the day to 97.20 on Wednesday. The euro gained 0.2% to $1.1152. Official data showed that the Eurozone's industrial production increased by 0.2% on month in November (+0.3% expected). USD/CAD fell 0.2% to 1.3039. Official data showed that Canada's existing-home sales declined 0.9% on month in December (+0.6% in November).
Meanwhile, both AUD/USD and NZD/USD edged up 0.1% to 0.6908 and 0.6619, respectively.
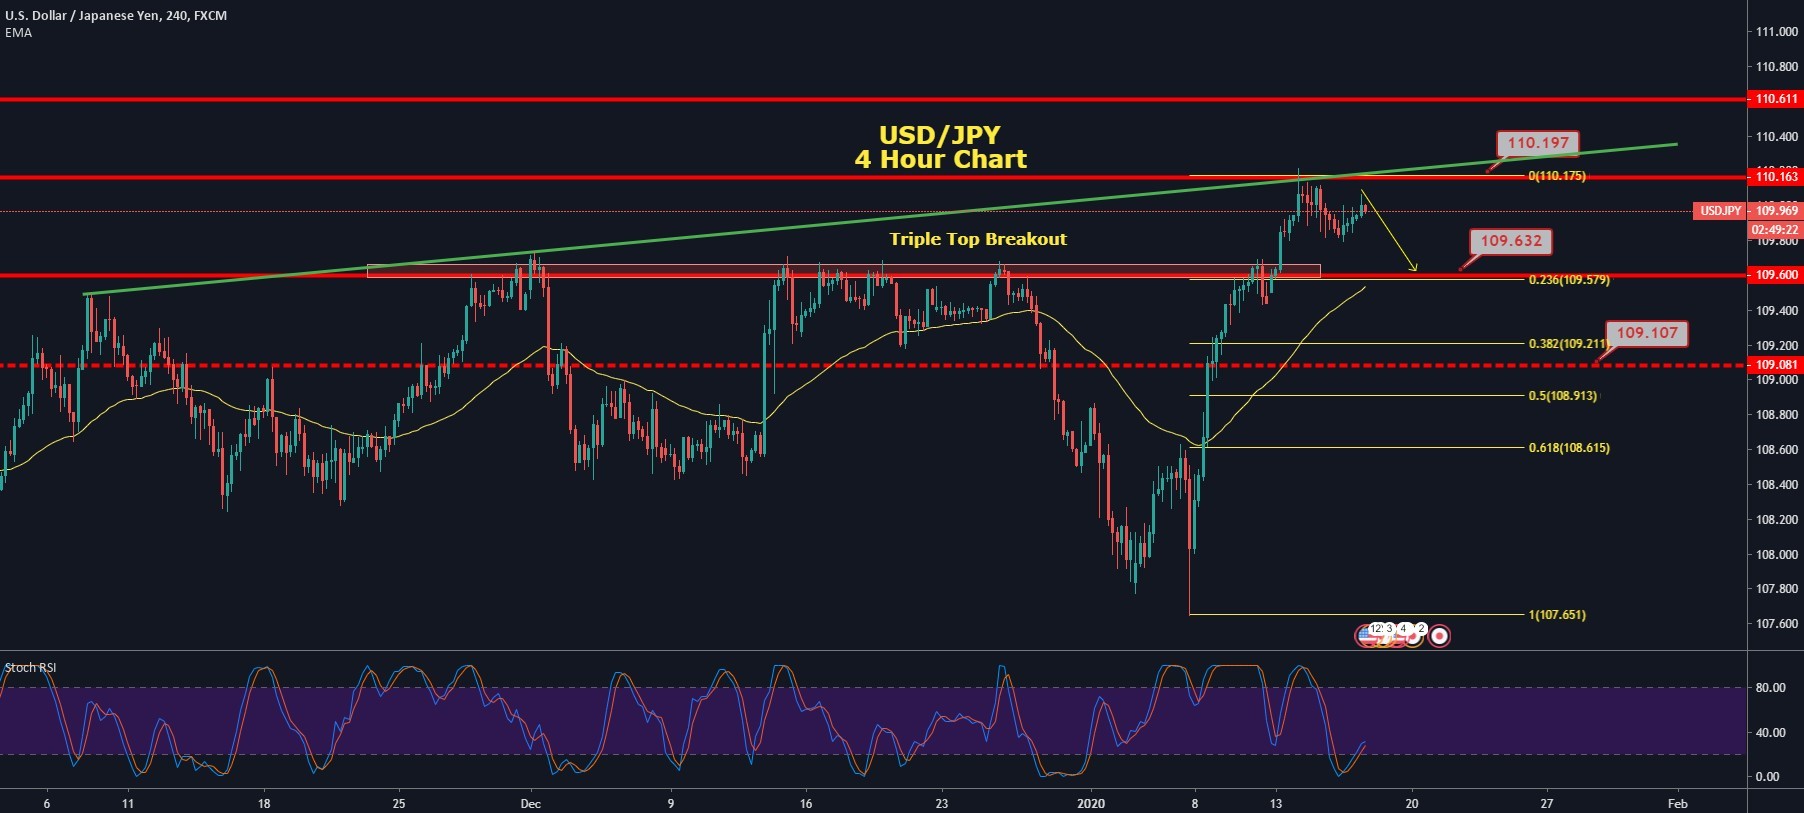
USD/JPY - Potential Setup for Bearish Retracement
The U.S. dollar lost its demand in the market, and the U.S. Dollar Index fell to its weekly low of 97.20, which also weighed on USD/JPY prices on Wednesday.
On the macroeconomic data front, the data from the United States came in the mix on Wednesday. At 18:30 GMT, the Core PPI and PPI for December showed a decline to 0.1% against the expected 0.2% and weighed on the U.S. dollar.
However, the Empire State Manufacturing Index for January exceeded the expectations and came in as 4.8 against forecasted 3.7 and supported the U.S. dollar.
On the other hand, at 4:50 GMT, the Annual M2 Money Stock from Japan came in line with the expectations of 2.7%. At 10:58 GMT, the Prelim Machine Tool Orders for the year in December came in as -33.6% in comparison to -37.9% of November.
The governor of Bank of Japan, Haruhiko Kuroda, said on Wednesday that BoJ would not hesitate to further ease monetary policy to achieve its 2% inflation target. He said that consumer inflation was at 0.5%, and these are affected by the decline in oil prices.
He said that while examining the risks, the bank will adjust its policies to maintain the momentum towards price stability. He added that BoJ would not hesitate to take further easing steps if risks heightened to an extent where the momentum of the price target decreased.
The demand for Japanese Yen also dropped because of the dovish comments from Kuroda and weak economic data. But it failed to raise the prices of USD/JPY on Wednesday amid the risk-off sentiment of the market.
USDJPY - Daily Technical Levels
| Support | Pivot Point: | Resistance |
| 109.78 | 109.89 | 109.99 |
| 109.68 | 110.10 | |
| 109.56 | 110.20 |
USD/JPY - Daily Trade Sentiment
The USD/JPY has completed a 50% Fibonacci retracement at 109.820, which is now working as a strong support level. Violation of this level can extend selling until 61.8% Fibo level of 109.650. The pair can exhibit bearish trend today, especially below 110.010 trading level.
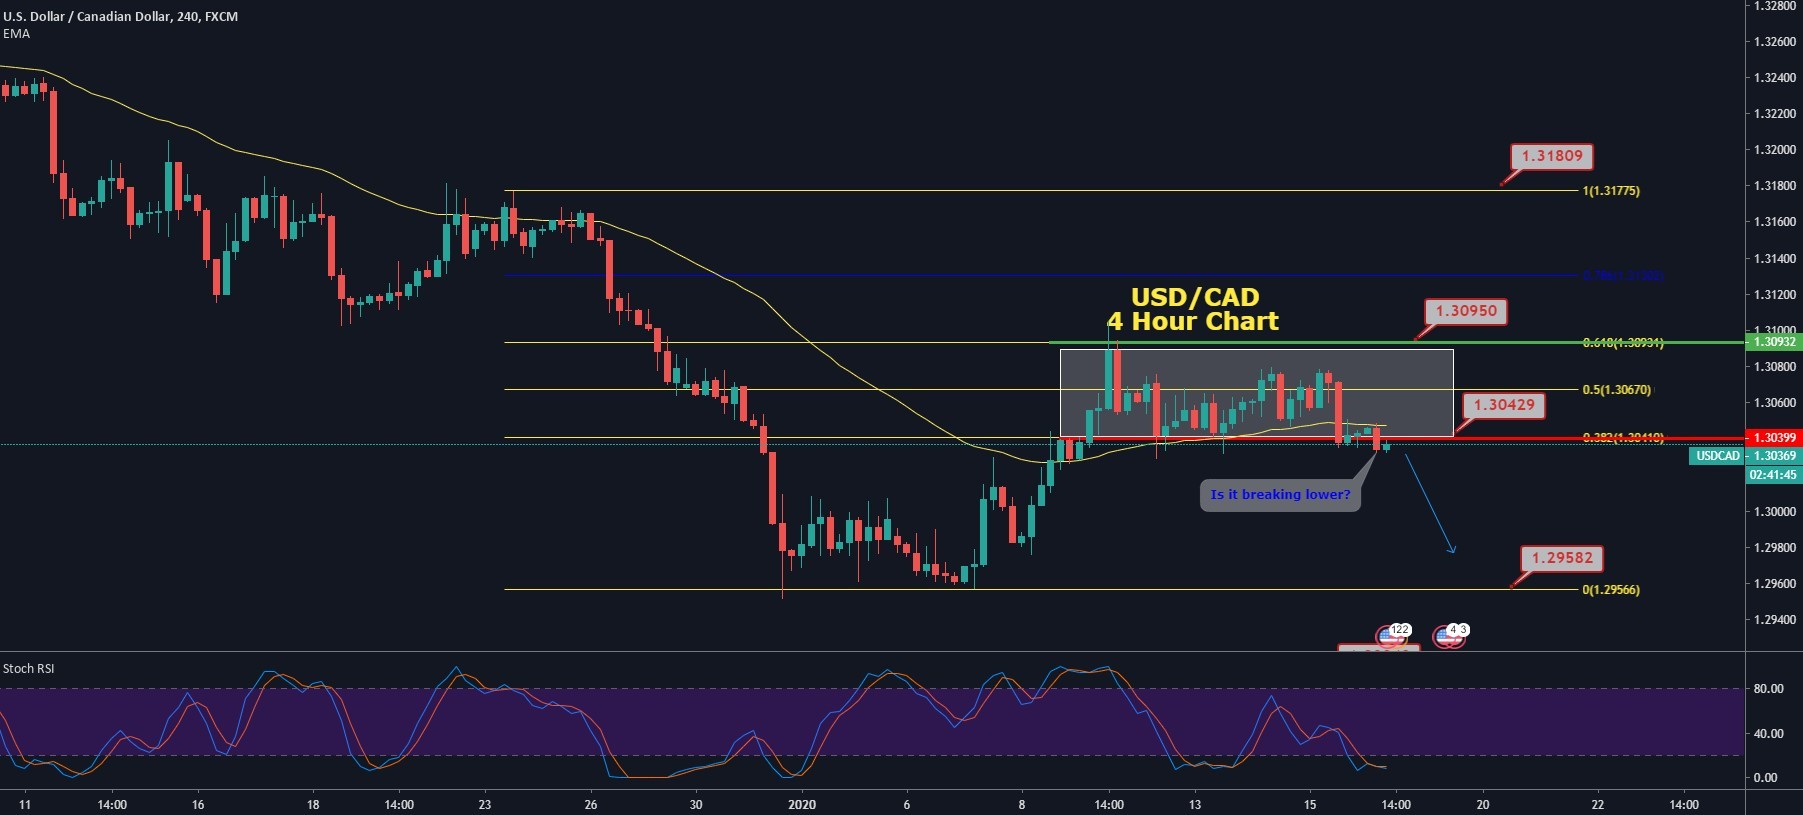
USD/CAD - Bullish Channel In-Play
The USD/CAD prices closed at 1.30410 after placing a high of 1.30780 and a low of 1.30349.
The USD/CAD pair dropped on Wednesday after posting gains for the last two days amid the decreased demand for the U.S. dollar. The U.S. dollar declined against its rival currencies on Wednesday after the release of details about the Phase-one trade deal between China and the U.S. The details revealed that the U.S. would retain 25% tariffs on $250 Billion worth Chinese industrial goods which were used in the U.S. manufacturing industries.
This news that most tariffs were remained in place and not removed by the United States disappointed the traders' expectations and weighed on the U.S. dollar. However, U.S. President Trump's administration was considered as a winner of the phase-one trade deal after the release of details.
The U.S. Dollar Index, which gauges the worth of the U.S. dollar against the basket of six currencies, also fell to its week lowest point 97.20 and added in the downward movement of USD/CAD prices.
On the data front, the U.S. Dollar was also disappointed by the release of weaker than expected PPI. At 18:30 GMT, the Core Producer Price Index (PPI) and the PPI for December from the U.S. were released, which showed a decline to 0.1% against the expectations of 0.2%.
The weak U.S. dollar dragged the USD/CAD prices on Wednesday. The prices were then further pulled down after the release of U.S. Crude Oil Inventories.
The weekly Crude Oil Inventories from the United States at 20:30 GMT, dropped to negative -2.5M from expected 0.4M and raised the prices of WTI Crude Oil on Wednesday. The rising WTI crude oil prices gave strength to commodity-linked currency-Loonie.
The increased demand for Canadian Dollar amid the rising Crude oil prices further dragged down the USD/CAD prices on Wednesday to the lowest point of the 1.303 level. There was no release of macroeconomic data from Canada on Wednesday, which left the USD/CAD prices at the mercy of U.S. dollar & Crude Oil.
USD/CAD- Daily Technical Levels
| Support | Pivot Point: | Resistance |
| 1.3021 | 1.3050 | 1.3067 |
| 1.3005 | 1.3095 | |
| 1.2976 | 1.3112 |
USD/CAD- Daily Trade Sentiment
The USD/CAD is trading at 1.3036 at the lower corner of the sideways channel. Closing of candle below this level is likely to trigger a bearish breakout in the USD/CAD. The RSI and Stochastics are already in the selling zone, while the pair has already crossed below 50 periods EMA which may drive bearish bias in the USD/CAD pair today. On the lower side, the pair can drop further until 1.3000 and 1.2975 today. Let's look for selling trades on the USD/CAD pair.
AUD/USD – Choppy Session Continues
The AUD/USD pair closed at 0.69000 after placing a high of 0.69164 and a low of 0.68769. The movement for AUD/USD was steady on Wednesday as it closed its day on the same level it started its day with i.e., 0.69000.
The pair AUD/USD remained under confusion throughout the day on Wednesday amid the mixed sentiment of the market. The U.S. & China signed their phase-one trade deal and released the details of a deal that day.
The long-awaited phase-one deal which remained under negotiations between U.S. & Chinese trade representatives was finally reached and signed by U.S. President Donald Trump and Chinese top trade envoy, Liu he on Wednesday.
The deal included most wins for U.S. President Donald Trump, but the implementation and enforcement of agreement could prove difficult for both sides as the U.S. retained 25% tariffs on $250B Chinese imports.
According to the signed deal, China committed to buy an additional $200 Billion of U.S. goods & Services in 2020-2021 than it did in 2017. China also agreed to provide better protection to U.S. intellectual properties. Both sides committed that they would not devalue their currency to support their exports illegally.
There were more details related to commitments made from both sides mentioned in an 86-page-long agreement. However, the text of accord failed to provide enough information to define how these commitments will work in practice. It was also unclear whether China would interpret it differently than the U.S.
The fact that the U.S. & China after 19 months of Trade war finally reached to an agreement was supportive for AUD/USD pair. As Australia is the largest trading partner of China, the progress towards decreasing trade disputes between the world's biggest economies helped the Australian Dollar.
However, another fact that the U.S. retained most of the tariffs on Chinese imports and vague details of the phase-one deal raised concerns of traders whether China would follow the deal or not. These risky concerns weighed on the Australian Dollar.
The mixed sentiment in the market made Aussie traders confused, and the pair first rose and then started to drop on Wednesday and closed its trading session at the same level it was opened with. Besides, the Reserve Bank of Australia has revealed that it will stimulate using central-bank backed digital tokens in the wholesale payment system.
Facebook's cryptocurrency has hit a regulatory brick wall, and central banks have still not convinced that cryptocurrencies like bitcoin could offer benefits over traditional money. But the RBA is set to test whether the digital currency issued by Central bank could play a useful role in the payment settlement system.
The bank is enthusiastic that what would happen if the central bank-backed digital currency were issued to commercial banks in replacement of their exchange settlement account balances.
On the data front, there was no economic data release from China or Australia. But from the American side, the Core Producer Price Index (PPI) and the Producer Price Index (PPI) for December were released at 18:30 GMT. Both indexes came in short of expectations as 0.1% against 0.2% and weighed on the U.S. dollar.
The U.S. dollar remained stressful throughout the day amid increased concerns of traders after the release of details of the phase-one trade deal. U.S. Dollar Index also fell to 97.20 its weekly lowest point on Wednesday.
AUD/USD - Technical Levels
| Support | Pivot Point: | Resistance |
| 0.6884 | 0.6900 | 0.6923 |
| 0.6861 | 0.6939 | |
| 0.6844 | 0.6963 |
AUD/USD - Daily Trade Sentiment
The AUD/SUD is finally breaking above the 38.2% Fibonacci retracement mark of 0.6920. Closing of the candle above this level can extend bullish rally until 0.6945 and 0.6962, which marks 50% and 61.8% Fibonacci retracement levels.
On the 4 hour chart, the AUD/USD has also formed a bullish channel that is likely to keep the AUD/USD bullish. Besides, the 50 periods EMA is also supporting the bullish bias until 0.6950. The support continues to be 0.6915 and 0.6885 today.
Try Secure Leveraged Trading with EagleFX!
https://www.fxstreet.com/analysis/top-trade-setups-in-forex-u-s-retail-sales-on-the-cards-202001161209
2020-01-16 12:09:00Z
CBMiZmh0dHBzOi8vd3d3LmZ4c3RyZWV0LmNvbS9hbmFseXNpcy90b3AtdHJhZGUtc2V0dXBzLWluLWZvcmV4LXUtcy1yZXRhaWwtc2FsZXMtb24tdGhlLWNhcmRzLTIwMjAwMTE2MTIwOdIBAA
Bagikan Berita Ini


0 Response to "Top Trade Setups in Forex – U,S, Retail Sales on the Cards - FXStreet"
Post a Comment