Fear of Bank contagion following the collapse of SVB and Signature Bank, the Fed’s 0.25% rate hike, and a weak banking sector is muting risk sentiment and leading to rises in Gold, Bitcoin, and the Japanese Yen.
The difference between success and failure in Forex / CFD trading is highly likely to depend mostly upon which assets you choose to trade each week and in which direction, and not on the exact methods you might use to determine trade entries and exits.
So, when starting the week, it is a good idea to look at the big picture of what is developing in the market as a whole, and how such developments and affected by macro fundamentals, technical factors, and market sentiment. There are just a very few valid long-term trends in the market right now, which might be exploited profitably. Read on to get my weekly analysis below.
I wrote in my previous piece on 19th March that the best trade opportunities for the week were likely to be:
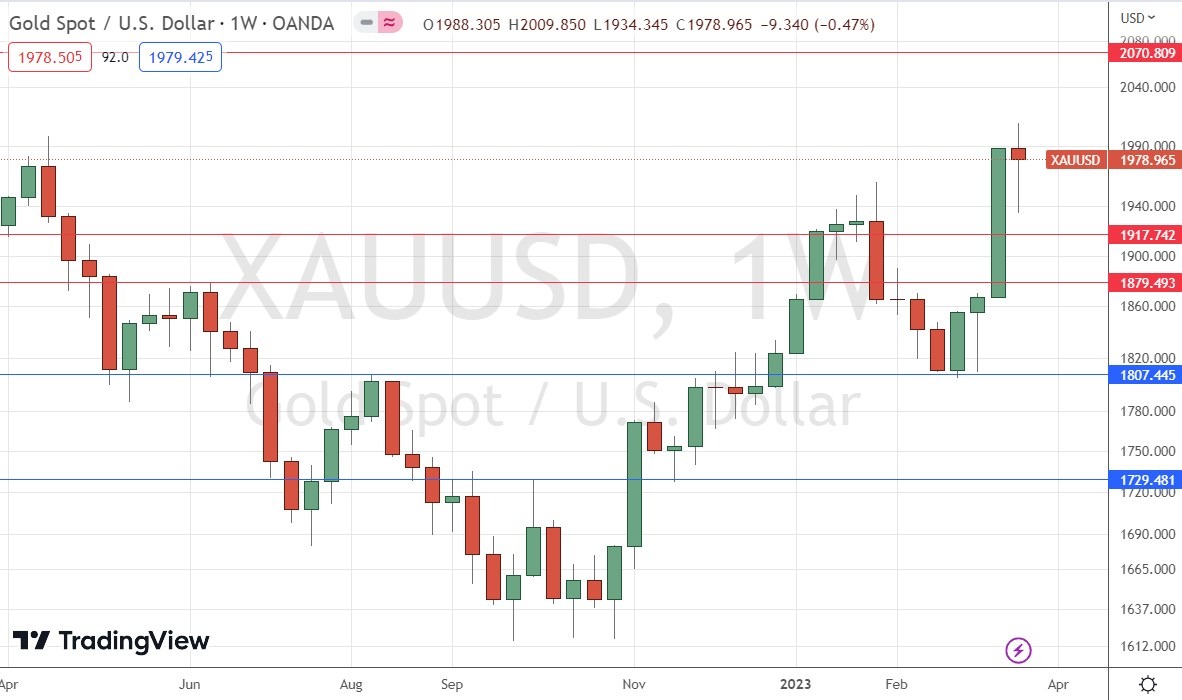
- Long Gold against the USD – the price declined over the week by 0.47%.
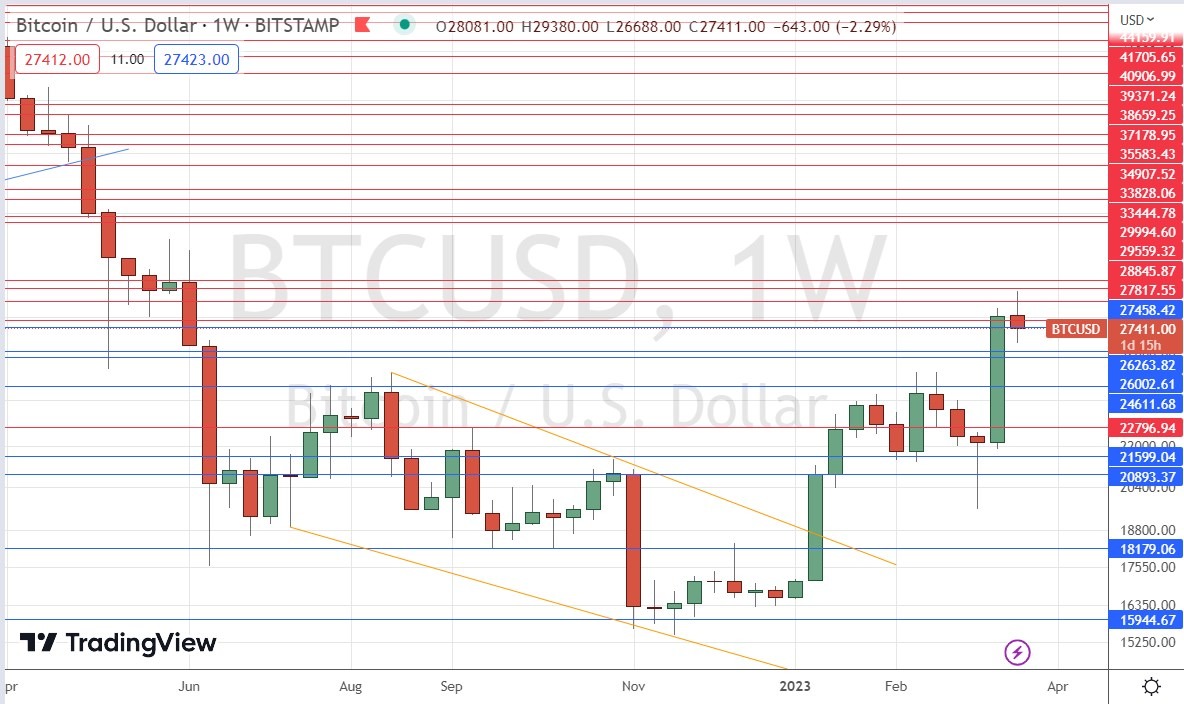
- Long Bitcoin against the USD – the price declined over the week by 2.20%.
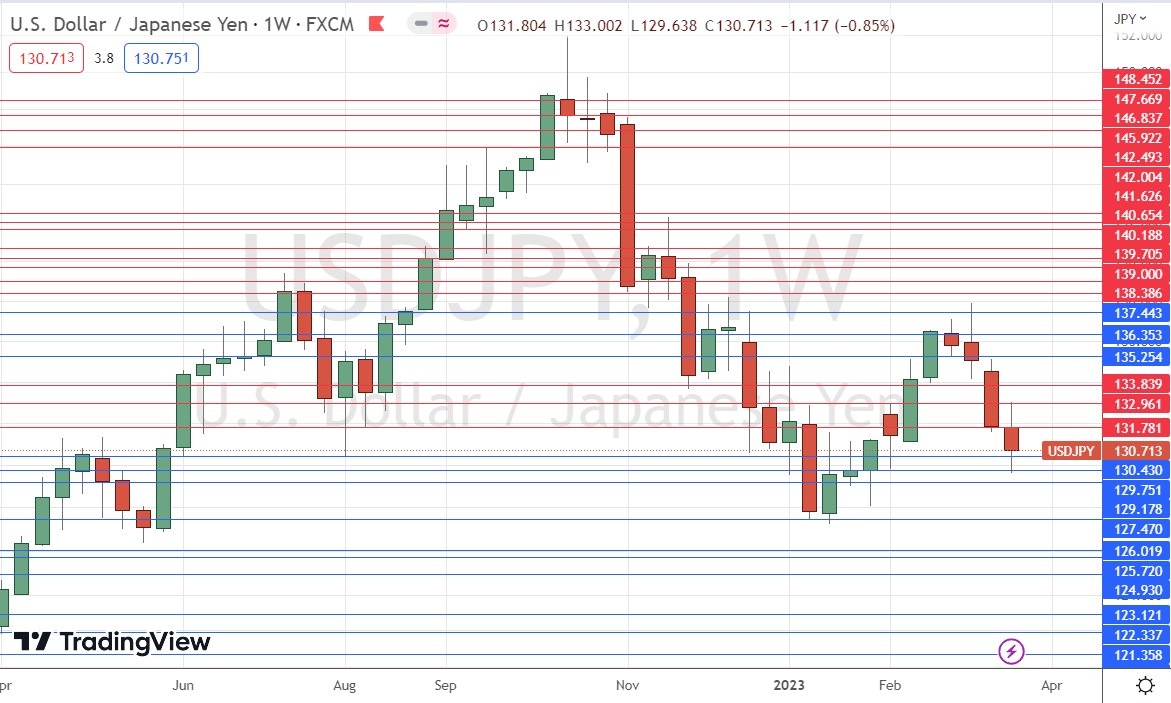
- Long Japanese Yen against the USD – the price rose over the week by 0.83%.
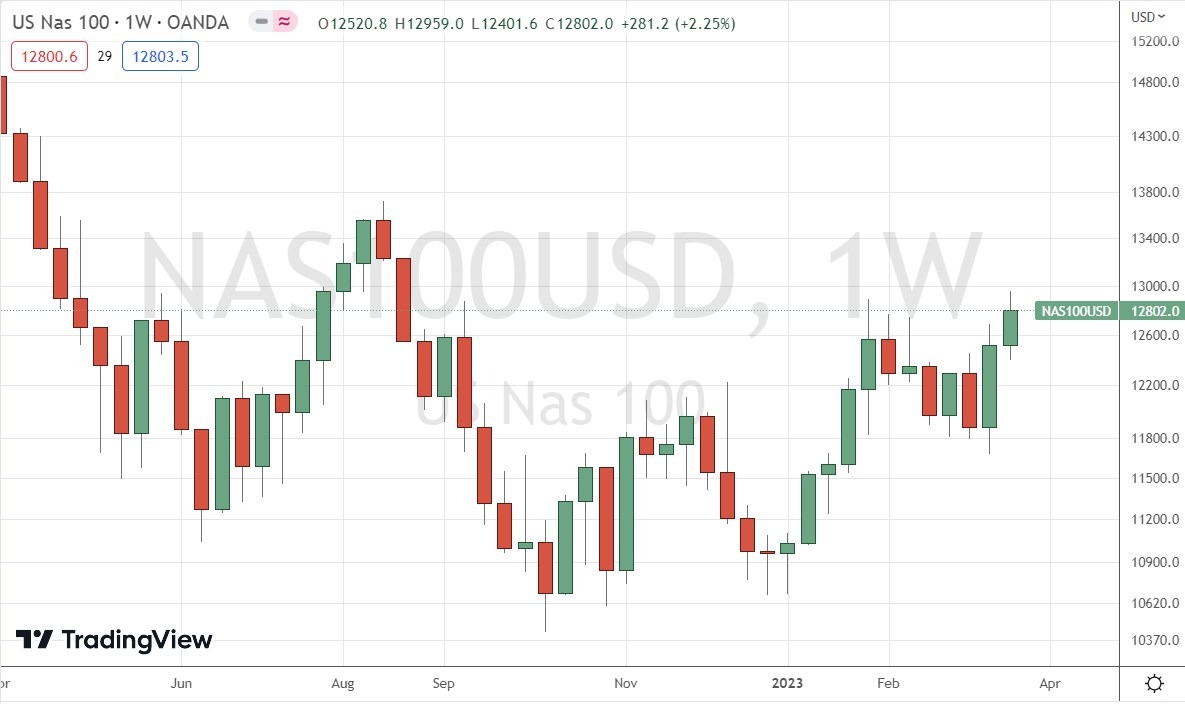
- Long of the NASDAQ 100 Index following a daily close above 12820 – this did not set up as there was no daily close last week above 12820.
Unfortunately, these trades produced an overall averaged loss of -0.61%.
The news is dominated by three major issues:
- A continuing banking crisis. Although there were no additional bank failures last week, following the failures of Silicon Valley Bank and Signature Bank in the USA during the previous week, banking shares remains weak and bearish. The week ended with great concern over Deutsche Bank whose share price declined by approximately one third over the week.
- The Federal Reserve’s 0.25% rate hike. The hike was widely expected, although there was a strong minority belief that the Fed would pass on any further hike. The Fed strongly hinted this would be the last hike in the present tightening cycle, which would leave the current 5% rate as the terminal rate. The Fed continued to express concern about inflation, and Powell stated that the banking crisis will not help the odds of a soft landing for the US economy.
- Rate hikes by the BoE and SNB. As expected, the Bank of England raised its interest rate by 0.25%, while the Swiss National Bank did the same by 0.50%.
- British and Canadian inflation data showed a slightly lower than expected increase in Canadian inflation, while the British data showed inflation rising by a full 0.5% more than had been expected, to a historically high rate of 10.4%. This has called into question the optimistic forecast by the UK government on inflation made during the previous week.
- Despite the banking crisis, rate hikes, and rising inflation data, many stock markets were able to end the week higher, notably the S&P 500 Index and the NASDAQ 100 Index. At one point, the NASDAQ was trading at a new 7-month high, suggesting that despite these problems, there seems to be a bull market in technology stocks.
There were two other significant data releases last week:
- US Unemployment Claims – this came in almost exactly as expected.
- Flash Services & Manufacturing PMI data for USA, UK, Germany, and France – in the USA, both sets of data came in better than expected. In Europe, the Services data was better than expected while the Manufacturing data was worse.
The coming week in the markets is likely to see a considerably lower level of volatility than last week, due to a low level of key data releases scheduled. However, an intensification of the ongoing banking crisis could trigger high volatility. This week’s key data releases are, in order of importance:
- US Core PCE Price Index data
- German Preliminary CPI data
- Australian CPI data
- US Final GDP data
- Canadian GDP data
- BoE Governor Bailey testifying before UK Parliament on the collapse of Silicon Valley Bank
- US Consumer Confidence data
- US Unemployment Claims data
The weekly price chart below shows the U.S. Dollar Index made another successive weekly decline, continuing the rejection of the key resistance level at 105.36.
However, it is notable that the weekly candlestick has a small real body and a large lower wick, which rejected a key support level. This suggests that we may be unlikely to see another decline over the coming week, despite the long-term bearish trend in which the Dollar is trading below its levels of both 3 and 6 months ago.
The US Dollar is likely to face conflicting pressures over the coming week, due to an ongoing fear of US bank contagion. It is hard to forecast the next Dollar movement so it may be better to focus upon trading other assets over the coming week.

We saw another weekly rise in the NASDAQ 100 Index over the week after a golden cross was made on the daily chart two weeks ago. At one point the Index was trading at a 7-month high, but it quickly sold off and closed the week below the key resistance level shown within the price chart below at 12820.
Stock markets continue to be shaken by the ongoing banking crisis, but we are seeing many tech shares making big rises as US inflation continues to fall, taking pressure off the Federal Reserve to continue hiking rates as the US 2-Year Treasury Yield trades well below 4%. However, this is tempered by the recent strong fall seen by the S&P 500 Index after it made a golden cross a few weeks ago, from which historically there have been no similar recoveries over the past half-century.
There is a clear resistance level shown in the price chart below at 12820. A daily close above that level will be a further bullish sign.
It seems that we have some bullish signs, but overall, we are seeing a split stock market with select tech stocks doing well while other sectors are not.

Last week saw the price of Gold fall slightly, following the previous week’s unusually strong rise. This week’s candlestick could be called a near-doji, which suggests indecision. This is not surprising as the price made a new 11-month high price and has struggled to overcome the big round number at $2,000, so I would not say this is a strong sign that the price will make a large decline this week. Another bullish sign is that the recent weekly candlestick’s lower wick is considerably larger than its upper wick, suggesting there is still strong buying at the recent lows.
The price ended the week below $2000 but within sight of its all-time high price made in March 2022.
Trend and breakout traders should seriously consider buying Gold even just on these technical indications. The deeper reason why Gold is rising is probably due to the decline in the US Dollar as a safe haven due to the banking crisis, and due to the banking crisis, itself. Bitcoin also seems to be playing a similar rose to Gold now.

Last week saw the price of Bitcoin fall slightly, following its strong rise over the previous week. This week’s candlestick is a doji, which suggests indecision. This is not surprising as the price made a new 11-month high price and has struggled to overcome two key resistance levels near the big round number at $30,000, so I would not say this is a strong sign that the price will make a large decline this week.
Trend and breakout traders should seriously consider buying Bitcoin even just on these technical indications. The deeper reason why Bitcoin is rising is probably due to the decline in the US Dollar as a safe have due to the banking crisis, and due to the banking crisis, itself. Gold also seems to be playing a similar rose to Bitcoin now.
Traders should keep in mind that Bitcoin is riskier than Gold and has a poor record as a safe haven, while Gold’s record is better. Buying Gold is likely to be the better trade here.

The Japanese Yen strengthened again over the past week, for the fourth successive week. This is not due to any material change in policy by the Bank of Japan or any fundamental factor, but simply due to the Japanese Yen’s attractiveness as a safe haven currency at a time of a banking crisis in the USA.
The Yen gained by more than 0.5% against a basket of currencies, with the US Dollar one of the main losers as the Dollar is generally weak, and in a long-term downwards trend.
The price chart below shows the weekly candlestick is of only a moderate size, and looks less bearish as it has a significant lower wick which has rejected both two key support levels and the big round number confluent with them at ¥130.00.
If the perception of a banking crisis persists, we are likely to see the USD/JPY currency pair continue to decline. However, I think the odds of this being a down week are much lower than they were last week.

As key markets are facing significant resistance levels against recent trends, I see the best trading opportunities this week as likely to require confirmations:
- Long Gold against the USD following a daily close above $2,000.
- Long Bitcoin against the USD following a daily close above $30,000.
- Short of the USD/JPY currency pair following a daily close below ¥130.
- Long of the NASDAQ 100 Index following a daily close above 12820,
Ready to trade our weekly Forex forecast? Here are the best Forex brokers to choose from.
https://news.google.com/rss/articles/CBMibWh0dHBzOi8vd3d3LmRhaWx5Zm9yZXguY29tL2ZvcmV4LXRlY2huaWNhbC1hbmFseXNpcy8yMDIzLzAzL3dlZWtseS1mb3JleC1mb3JlY2FzdC1tYXJjaC0yNnRoLWFwcmlsLTFzdC8xOTMzMDXSAQA?oc=5
2023-03-27 16:07:57Z
CBMibWh0dHBzOi8vd3d3LmRhaWx5Zm9yZXguY29tL2ZvcmV4LXRlY2huaWNhbC1hbmFseXNpcy8yMDIzLzAzL3dlZWtseS1mb3JleC1mb3JlY2FzdC1tYXJjaC0yNnRoLWFwcmlsLTFzdC8xOTMzMDXSAQA
Bagikan Berita Ini


0 Response to "Weekly Forex Forecast – NASDAQ 100 Index, Gold, Bitcoin, USD/JPY - DailyForex.com"
Post a Comment