Last week was dominated by a strong decline in the US Dollar, against its long-term bullish trend, and also a rise in US stock markets Riskier currencies such as the Australian and New Zealand Dollars, and the Euro and British Pound, rose strongly against the greenback.
Forex Brokers We Recommend in Your Region
See full brokers listThe difference between success and failure in Forex / CFD trading is highly likely to depend mostly upon which assets you choose to trade each week and in which direction, and not on the exact methods you might use to determine trade entries and exits.
So, when starting the week, it is a good idea to look at the big picture of what is developing in the market as a whole, and how such developments and affected by macro fundamentals, technical factors, and market sentiment.
Read on to get my weekly analysis below.
I wrote in my previous piece on 12th November that the best trade opportunities for the week were likely to be:
- Long of the USD/JPY currency pair. Unfortunately, the price fell by 1.31% over the week.
- Long of Cocoa futures. The price rose by 1.08%.
These trades produced a very small overall loss of 0.23%.
Last week was dominated by a strong decline in the US Dollar, against its long-term bullish trend, and also a rise in US stock markets Riskier currencies such as the Australian and New Zealand Dollars, and the Euro and British Pound, rose strongly against the greenback. The key driver of this was the lower-than-expected US and UK CPI (inflation) data releases, which suggest that the Fed is only going to be cutting rates, with markets pricing in total cuts of 0.50% by July 2024. With the Fed’s terminal rate seemingly having been reached already at 5.50%, the reversal in the monetary policy cycle from tightening to loosening is triggering bearish sentiment on the US Dollar, and it is boosting stock markets and other risky assets also. However, it is worth keeping in mind that economic data generally is not very strong, so the rise in stock markets is not as strong as the weakening in the US Dollar.
The other major data last week were US PPI and Retail Sales data, both of which came in lower than expected, suggesting declining inflationary pressure but also a weakening US economy.
Other important data releases last week were:
- US Unemployment Claims – this was approximately as expected.
- US Empire State Manufacturing Index – came in much better than expected.
- UK Retail Sales – this came in much worse than expected, suggesting a slowdown in the retail economy.
- UK Claimant Count Change – this was approximately as expected.
- Chinese Industrial Production – slightly better than expected.
- Australian Wage Price Index – as expected.
- Australian Unemployment Rate – as expected.
The coming week in the markets is likely to see a lower level of volatility compared to last week, as there will be fewer highly-important data releases. This week’s key data releases are, in order of importance:
- Reserve Bank of Australia Monetary Policy Meeting Minutes
- Canadian CPI (inflation)
- US FOMC Meeting Minutes
- US Unemployment Claims
- US Revised UoM Consumer Sentiment
- Flash Services & Manufacturing USA, UK, Germany, France
- German ifo Business Climate
It will be a public holiday in the USA and Japan in Thursday.
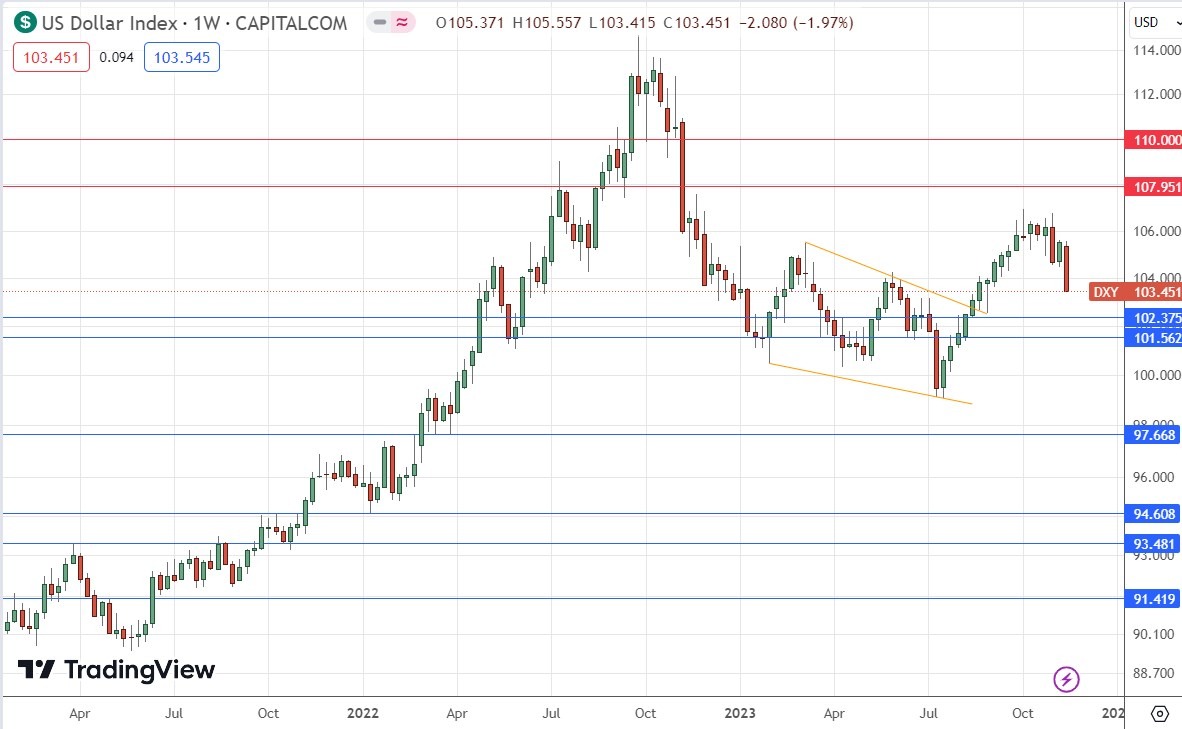
The US Dollar Index printed a large and strongly bearish candlestick last week, which closed right on the low of its range. This was the strongest downwards move in the greenback since July, and it has produced a dramatic trend change with the weekly close now below the prices of both 3 and 6 months ago. These are bearish signs.
Another bearish sign is that the price has room to fall before reaching the nearest support level at 102.38.
This new Dollar bearishness is supported by the lower-than-expected US inflation data released last week, which suggests that the Fed will now be working to cut rates rather than raise them.
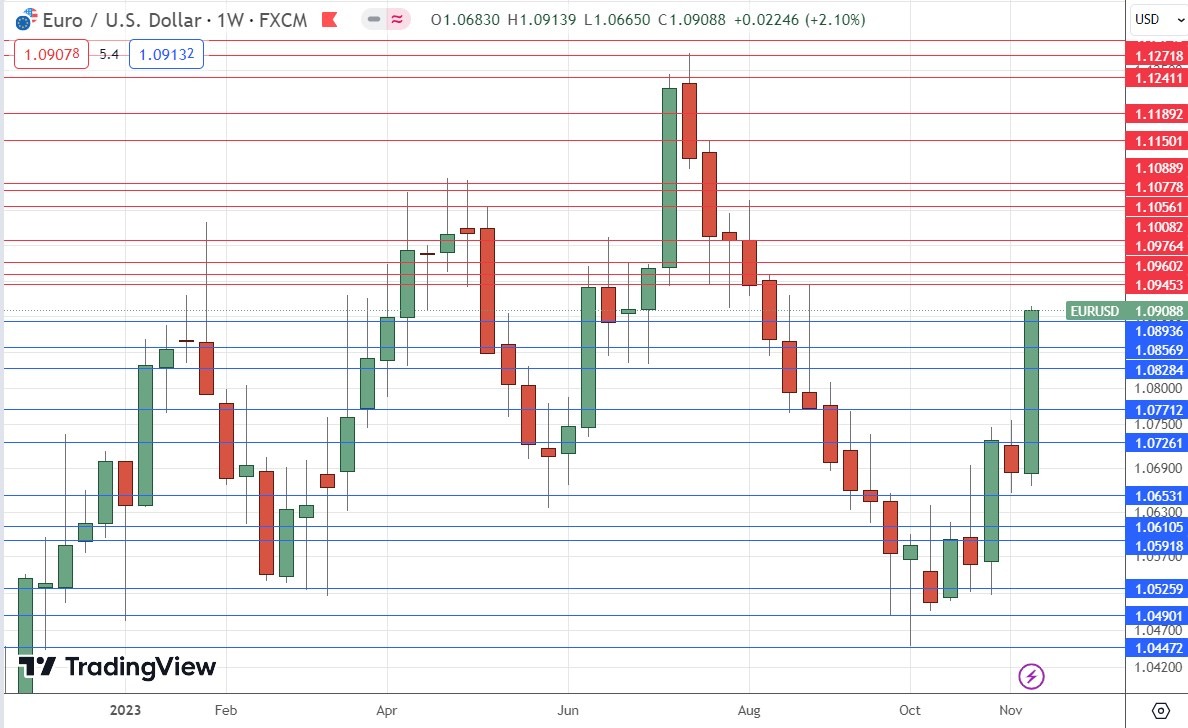
The EUR/USD currency pair printed an exceptionally large bullish candlestick over the week, closing very near the high of its range. The price ended the week making its highest daily close for more than 3 months.
Although these are bullish signs, bulls should beware the speed and suddenness of this bullish breakout, which suggests the price needs to spend some time consolidating or retracing before it will be safe to enter a new long trade here.
The Euro is one of the strongest major currencies right now.
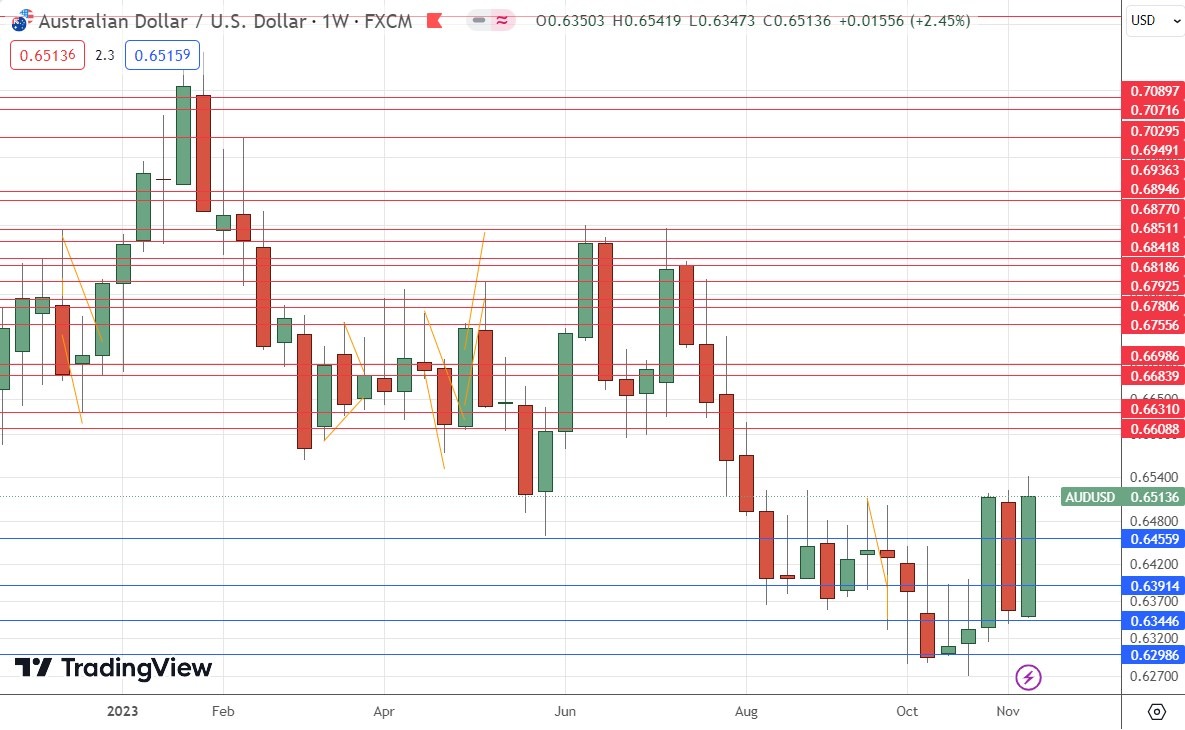
The AUD/USD currency pair printed a large bullish engulfing candlestick over the week, closing quite near the high of its range. The price ended the week making its highest daily close for more than 3 months but is still below its price of 6 months ago, suggesting mixed long-term trends.
Another reason for bulls to be cautious, despite the seeming strength of the bullish momentum here, is that the price action of recent weeks suggests ranging rather than trending behaviour, even though the price briefly traded at a new 3-month high.
For these reasons, I expect a bearish retracement over the short-term, or possibly a consolidation, before we start to see a serious bullish breakout with daily closes exceeding $0.6600.
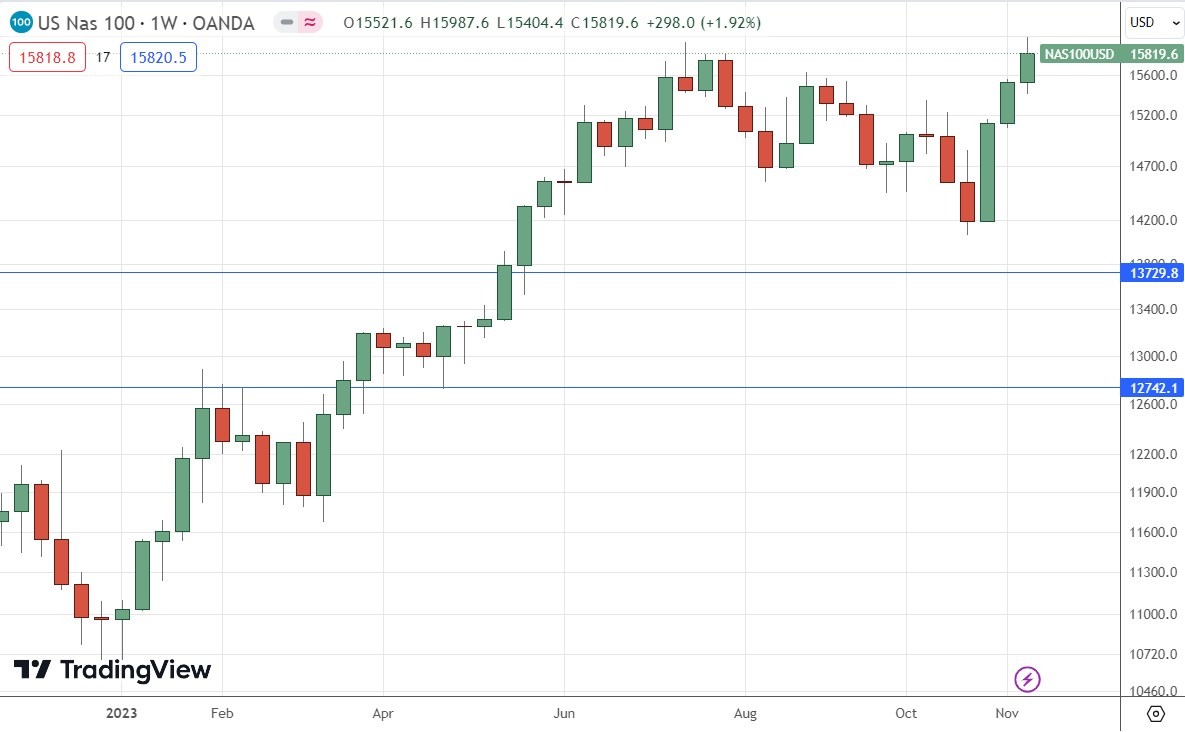
The NASDAQ 100 Index printed a third successive bullish candlestick, and briefly traded at its highest price seen since January 2022, before making the highest daily close seen since that time. The momentum slowed towards the end of the week, but despite the strong bearish retracement seen in recent weeks before this new bullish movement, we clearly have a bull market here, which is breaking to new highs.
The NASDAQ 100 Index has historically been a great investment on the long side, especially during a bull market, and with this latest break to a new high, we seem to have a signal saying it makes sense to be long here. This approach will be validated by the inflation and central bank outlooks, which point towards decreasing inflationary pressure and a new more dovish, rate cutting approach by the Federal Reserve.
I am happy to be long of the NASDAQ 100 Index.
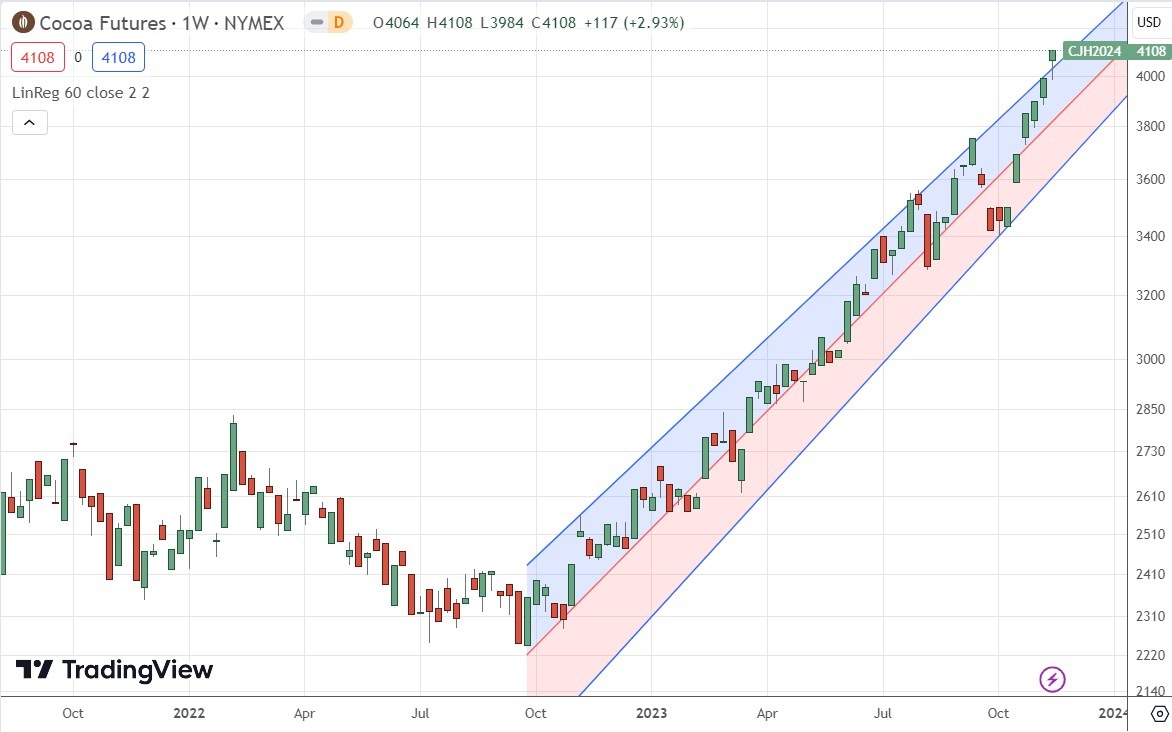
Cocoa futures have been in a strong bullish trend for over a year now and made another strong rise last week. The price chart below applies a linear regression analysis to the past 60 weeks and shows graphically what a great opportunity this has been on the long side.
The weekly candlestick was again firmly bullish, closing right on its high at a multi-year high price.
It is always a bit aggressive to enter without a pullback, especially right now with the price action above the upper band of the linear regression channel, but this is a strong trend that shows no sign of stopping on ever-increasing global demand for the superfood cocoa.
Trading commodities long on breakouts to new 6-month highs has been a very profitable strategy over recent years.
I see the best trading opportunities this week as:
- Long of the NASDAQ 100 Index.
- Long of Cocoa futures.
Ready to trade our weekly Forex forecast? Here are the best Forex brokers to choose from.
https://news.google.com/rss/articles/CBMieWh0dHBzOi8vd3d3LmRhaWx5Zm9yZXguY29tL2ZvcmV4LXRlY2huaWNhbC1hbmFseXNpcy8yMDIzLzExL3dlZWtseS1mb3JleC1mb3JlY2FzdC0xOXRoLW5vdmVtYmVyLTI1dGgtbm92ZW1iZXItMjAyMy8yMDM4NTHSAQA?oc=5
2023-11-20 09:47:12Z
CBMieWh0dHBzOi8vd3d3LmRhaWx5Zm9yZXguY29tL2ZvcmV4LXRlY2huaWNhbC1hbmFseXNpcy8yMDIzLzExL3dlZWtseS1mb3JleC1mb3JlY2FzdC0xOXRoLW5vdmVtYmVyLTI1dGgtbm92ZW1iZXItMjAyMy8yMDM4NTHSAQA
Bagikan Berita Ini


0 Response to "Weekly Forex Forecast – EUR/USD, AUD/USD, NASDAQ 100, Cocoa Futures - DailyForex.com"
Post a Comment