By: DailyForex.com
The difference between success and failure in Forex trading is very likely to depend upon which currency pairs you choose to trade each week, and not on the exact trading methods you might use to determine trade entries and exits. Each week I am going to analyze fundamentals, sentiment and technical positions in order to determine which currency pairs are most likely to produce the easiest and most profitable trading opportunities over the next week. In some cases it will be trading the trend. In other cases it will be trading support and resistance levels during more ranging markets.
Big Picture 22nd April 2018
In my previous piece last week, I forecasted that the best trades would be long GBP/USD and long WTI Crude Oil. After initially rising, GBP/USD fell sharply in the second half of last week and ended down by 1.57%, while WTI Crude Oil rose by 0.96%. This produced an average loss of 0.31% over the week.
Last week again saw a still-volatile stock market where the S&P 500 initially seemed to break above a key resistance level at 2674 before pulling back and closing below it, which might be a bearish sign. Crude Oil has continued to rise to new long-term high prices, making a new 3-year high. The Forex market was dominated by a relatively strong rise in the U.S. Dollar as 10-year yields barely made a new 4-year high.
There was little in the way of surprising economic data releases last week. There are no obvious drivers of sentiment except the U.S. yield situation, worries over the U.S. / China Trade dispute, and tension over what will happen regarding the Iran deal as it comes up for renewal on 12th May.
Fundamental Analysis & Market Sentiment
Fundamental analysis tends to support the U.S. Dollar; and this seems to be increasingly supported by sentiment. Next week will bring a release of Advance U.S. GDP data which should be very important to the market, as well as central bank input concerning the Euro and the Japanese Yen.
Technical Analysis
U.S. Dollar Index
This index printed a reasonably large and convincingly bullish outside candlestick, within a wider consolidation pattern which has lasted almost three months. The price is very close to its level of three months ago, suggesting that the long-term bearish trend is about to come to an end. A close next week above the resistance level of 11751 would very convincingly end the bearish trend.

EUR/USD
This pair has been in a long-term bullish trend for a long time, but it looks as if it is about to turn significantly more bearish, in line with the U.S. Dollar Index shown above. The price is very close to its level of 3 months ago and this pair tends to follow its 3-month price trend. The chart below shows a relatively narrow consolidation pattern which has been playing out below key resistance at the psychological level of 1.2500. A breakdown below the lower edge of this recent multi-month range could suggest the beginning of a major bearish cycle, giving long-term traders an opportunity to take profitable short positions. However, the price action is not quite there yet. The British Pound and Japanese Yen have been showing more strength against the U.S. Dollar than the Euro, so if the Dollar does turn convincingly bullish, the Euro seems positioned to be the best vehicle to use as a pair to exploit that.

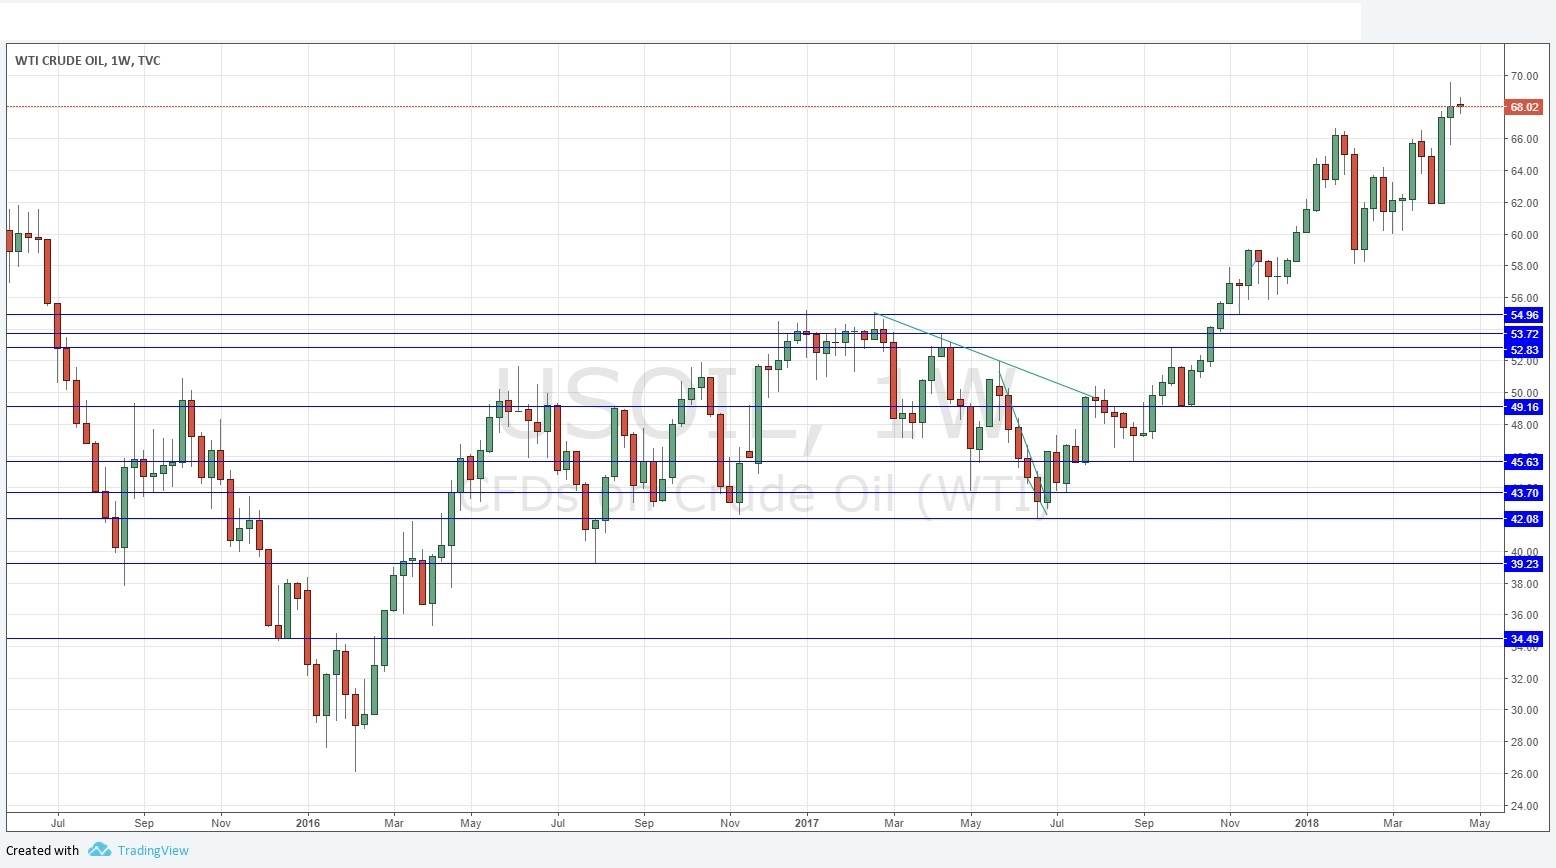
Crude Oil
There is a strong long-term bullish trend, with the price continuing to make new 3.5-year highs. Last week’s candle was small and less bullish, forming a near-doji. However, new high prices are not to be ignored, there is a strong long-term trend, and there is residual tension in the Middle East which could continue to push sentiment in favor of still higher prices.
S&P 500 Index
I just wanted to take a quick look at the U.S. stock market’s major index, so we can see that the stock market is still looking dangerous and possibly bearish. The moving average shown in the daily chart below is the 200-day simple moving average. This is arguably action as support, but the level above at 2674 seems to be acting as resistance. We can also draw a medium-term bearish trend line at the key swing highs. A breakout above the upper trend line would be a bullish sign for stocks.

Conclusion
Bullish on WTI Crude Oil.
Read Again Forex Forecast: Pairs in Focus : https://ift.tt/2qPNR4VBagikan Berita Ini


0 Response to "Forex Forecast: Pairs in Focus"
Post a Comment