DailyFX.com -
Talking Points:
- This afternoon brings what's expected to be one of the least eventful FOMC rate decisions in years.
- The rest of this week brings more high-impact data out of the U.S., so hope should not be abandoned for USD-volatility as we move towards week-end.
- Are you looking to improve your trading approach? Check out Traits of Successful Traders . And if you're looking for an introductory primer to the Forex market, check out our New to FX Guide .
To receive James Stanley's Analysis directly via email, please sign up here
FOMC on the Horizon
Later this afternoon brings what's looking to be one of the least exciting Federal Reserve rate decisions in years. This is Chair Yellen's last meeting at the bank with Mr. Jerome Powell set to take over in February: There's no press conference for today's meeting, nor are there any updated economic projections. Also of consideration is the fact that this meeting is likely sandwiched between two rate hikes, after the Fed moved in December and with markets carrying 76% chance of a move at the bank's next meeting in March.
But all hope is not lost in the realms of U.S. Dollar volatility, as the rest of the week brings a couple of additional high-impact prints with ISM numbers being released tomorrow and Non-Farm Payrolls set to be released on Friday morning. Below, we're taking a step back to look at the U.S. Dollar from a few different angles in a few different currency pairs with the goal of setting up for the next few days.
On the data front - next week is light on US issues, with one high-impact item on the calendar and that's for Monday. The more pertinent items for currency traders will likely be the RBA rate decision on Monday night, with a really big Super Thursday event out of the Bank of England on Thursday. The week closes with a bang to Canadian data with employment numbers being released next Friday morning.
The U.S. Dollar Remains Near Three-Year Lows
The Dollar got punched last week around some comments offered from U.S. Secretary Steven Mnuchin, and even after those comments were walked-back a day later by President Trump, weakness in the Greenback persists. Making matters difficult for trend continuation strategies is the fact that USD sellers have appeared to soften or dry up as we near prior lows, and those lows are showing around a key Fibonacci level at 88.42. This is the 61.8% retracement of the 2014-2017 major move in DXY, and thus far bears have been unable to take this level out.
U.S. Dollar via 'DXY' Weekly: Support Around 61.8% Fib
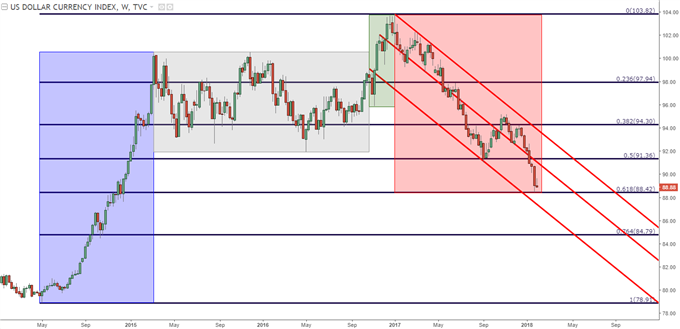
Chart prepared by James Stanley
We had looked at a level of resistance in DXY last week around the 89.50 level, and since then we've seen two separate inflections off of that area. This could make 89.50 a bit less attractive for short-side continuation plays, as a fourth test of resistance may be met with diminished selling. Instead, traders can cast their gaze towards the psychological level of 90.00 up to the prior area of swing-support around 90.25 to produce a potential resistance zone that can keep the door open for short-side USD strategies.
DXY Hourly Chart with Potential Resistance Applied
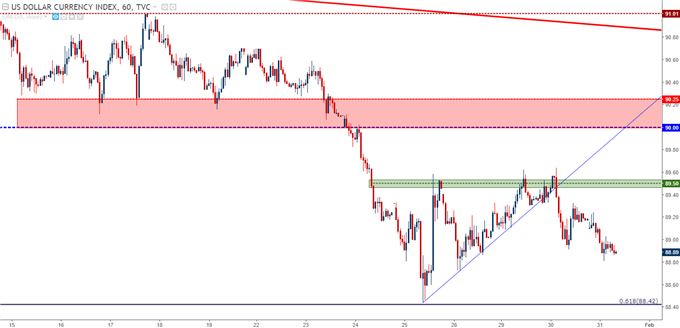
Chart prepared by James Stanley
EUR/USD
We've written about EUR/USD quite a bit over the past week after the ECB-fueled bullish breakout . The Dollar was sliding ahead of the ECB rate decision, but as Mr. Draghi took the podium Dollar sellers and Euro bulls really hastened the move, eventually seeing the pair test the vaulted 1.2500 level of psychological resistance . When EUR/USD ran into 1.2000 in the second half of last year, this was one of the few items that actually appeared to bring about a behavioral change in the pair, even if only for a brief couple of months.
In yesterday's article, we looked at the return of bullish price action in the pair after 4 th quarter Euro-Zone GDP , with focus on a zone of support around 1.2375-1.2390. So far, that zone's held up after bulls came back to offer support; but as we approach a heightened outlay of risk over the next three days, the pair is trading perilously close to that area of resistance that proved too difficult to break.
EUR/USD Hourly Chart, Lower-High Resistance
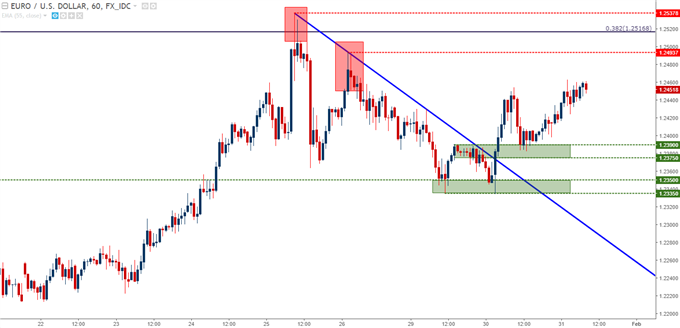
Chart prepared by James Stanley
GBP/USD with Short-Term Reversal Potential
Of pairs that might be attractive for playing short-term reversals, GBP/USD is on the list. Cable posed an aggressively bullish breakout last week, continuing the climb that had started two weeks prior when the pair was digging out support around the 1.3500-handle. Since then, bulls have been in control for much of the time, eventually pushing prices all the way up towards 1.4350. But - since that high was set last Thursday, strength has started to slip and a series of lower-lows and lower-highs has shown up on the hourly chart.
GBP/USD Hourly: Lower-Lows, Highs After Last Week's Breakout
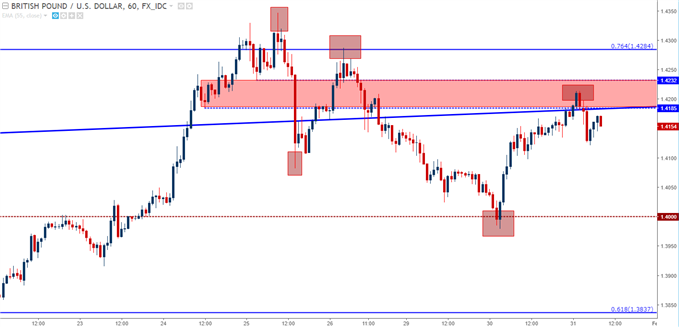
Chart prepared by James Stanley
USD/JPY: A Range Within a Range
Interest around USD/JPY appears to have waned of recent , as prices have spent much of the last week battering back-and-forth in a 70-pip range.
USD/JPY Hourly with Range
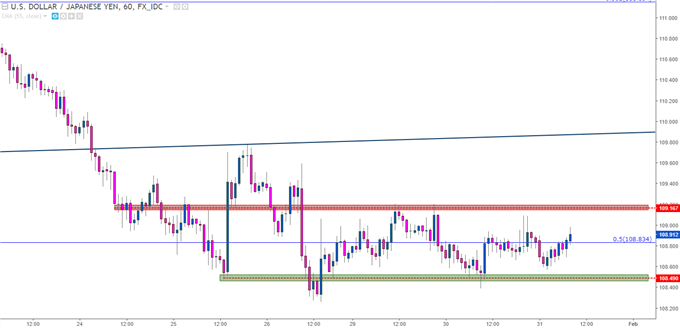
Chart prepared by James Stanley
What makes the current backdrop around USD/JPY so interesting at the moment isn't the hourly chart, it's the longer-term setup, as this short-term range is taking place at the bottom of an even longer-term range. The longer-term range has been in-force since Q2 of last year, and prices have spent most of the past week battering around in this area, giving rise to the idea that we may be seeing a shift as bulls return to buy support in the longer-term range, using support in the shorter-term range as a jumping off point.
USD/JPY Daily: Short-Term Range (Green) in Terms of Longer-Term Range
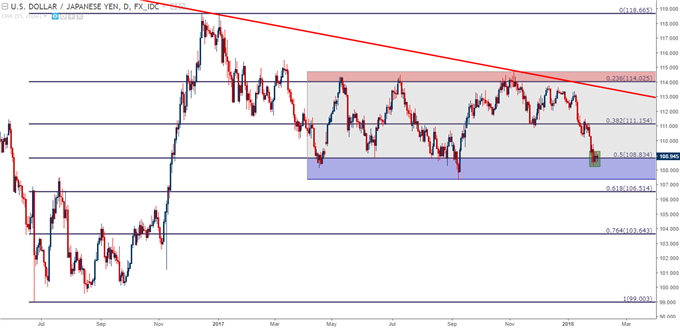
Chart prepared by James Stanley
AUD/USD Thwarted at Prior Highs - RBA Next Week
Of all the pairs to work with USD-weakness over the past month-and-a-half, few put in the consistency that showed in AUD/USD. After catching support at .7500 in mid-December, the pair went on a rip-roaring run that catapulted prices all the way up to the two-and-a-half year high at .8125, which was set last September. But since then - bulls have gotten very shy as the pair re-approached that prior price of resistance.
AUD/USD Daily: V-Shaped Reversal Finds Resistance at Prior Highs
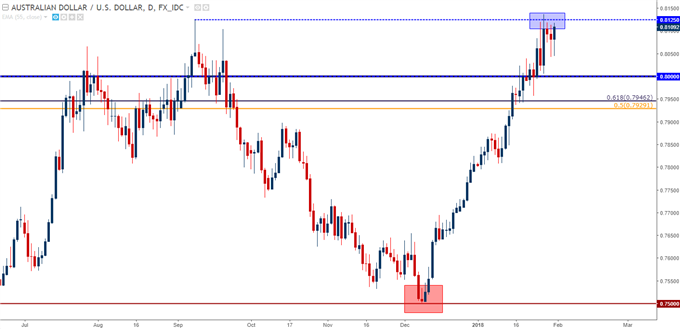
Chart prepared by James Stanley
To read more:
Are you looking for longer-term analysis on Euro, or the U.S. Dollar? Our DailyFX Forecasts for Q1 have a section for each major currency, and we also offer a plethora of resources on our EUR/USD , GBP/USD , USD/JPY , AUD/USD and U.S. Dollar pages . Traders can also stay up with near-term positioning via our IG Client Sentiment Indicator .
--- Written by James Stanley , Strategist for DailyFX.com
To receive James Stanley's analysis directly via email, please SIGN UP HERE
Contact and follow James on Twitter: @JStanleyFX
original source
DailyFX provides forex news and technical analysis on the trends that influence the global currency markets.
Learn forex trading with a free practice account and trading charts from IG .
The views and opinions expressed herein are the views and opinions of the author and do not necessarily reflect those of Nasdaq, Inc.
Read Again Forex Majors: Price Action Setups Ahead of January FOMC : http://ift.tt/2DPr0Lf
Bagikan Berita Ini


0 Response to "Forex Majors: Price Action Setups Ahead of January FOMC"
Post a Comment