The difference between success and failure in Forex / CFD trading is highly likely to depend on which assets you choose to trade each week and in which direction, and not on the methods you might use to determine trade entries and exits.
When starting the week, it is a good idea to look at the big picture of what is developing in the market as a whole and how such developments are affected by macro fundamentals, technical factors, and market sentiment.
Read on to get my weekly analysis below.
I wrote in my previous piece on 7th January that the best trade opportunity for the week was likely to be:
- Long of the EUR/USD currency pair. This rose by 0.07% over the week.
Last week saw very low directional volatility in the Forex market, with most currencies consolidating and fluctuating by very little. There was more action in stocks and commodities, with major stock markets, especially in the US, Europe, and Japan rising firmly. The Japanese Nikkei 225 Index made a new 34-year high price.
This is rise in stock markets was driven mostly by investors regaining confidence in lower short-term US interest rates but has also been helped by the US core CPI (inflation) data which was found last week to have dropped over the previous month. Another factor giving a tailwind was lower than expected US PPI data released on Friday (a month-on-month contraction of 0.1% when an increase by the same amount was expected), which reinforced the idea that US inflation is actually falling despite its headline annualized rate showing a small increase.
We also saw last week important data releases of Australian and Swiss inflation. The Australian data showed a drop in the annualized rate to 4.3% after 4.4% was expected. The Swiss data showed month-on-month prices unchanged, while deflation of 0.1% was expected.
There were a few other important economic data releases last week:
- Governor of the Bank of England testimony before the UK parliament – no surprises.
- UK GDP – slightly better than expected, with month-on-month growth at 0.3% while 0.2% was expected.
- US Unemployment Claims – almost exactly as expected.
- Chinese CPI (inflation) – showed annualized deflation of 0.3% while a contraction of 0.4% was expected.
The most important data over the coming week will probably be UK CPI (inflation) on Wednesday.
Other major economic data releases this week will be:
- US Retail Sales
- Canadian CPI (inflation)
- UK Claimant Count Change (Unemployment Claims)
- US Preliminary UoM Consumer Sentiment
- US Empire State Manufacturing Index
- US Unemployment Claims
- UK Retail Sales
- Australian Unemployment Rate
- Chinese Industrial Production
Monday will be a public holiday in the USA.
Let us look at the relevant data of currency price changes and interest rates to date, which I compiled using a trade-weighted index of the major global currencies:
For the month of January, I forecasted that the EUR/USD would rise in value, and that the USD/JPY currency pair would fall in value. The performance of this forecast so far is:
Currency Pair | Forecasted Direction | Interest Rate Differential | Performance to Date |
|---|---|---|---|
EUR/USD | Long ↑ | -1.00% (4.50% - 5.50%) | -0.81% |
USD/JPY | Short ↓ | 5.60% (5.50% - -0.10) | -2.76% |
Monthly Forecast January 2024 Performance to Date
Last week, I forecasted that the GBP/JPY currency cross would fall in value. Unfortunately, it rose in value over the week by 0.53%.
I made no forecast this week, as there were no strong counter-trend price movements.
Directional volatility in the Forex market decreased last week with not a single one of the most important currency pairs fluctuating by more than 1%. Volatility is likely to increase over the coming week, as it is simply unlikely to remain so low for very long.
Last week was dominated by relative strength in the British Pound, and relative weakness in the Australian Dollar, but the amounts are so low that this has little meaning.
You can trade my forecasts in a real or demo Forex brokerage account.
I teach that trades should be entered and exited at or very close to key support and resistance levels. There are certain key support and resistance levels that can be monitored on the more popular currency pairs this week.
Currency Pair | Key Support / Resistance Levels |
|---|---|
AUD/USD | Support: 0.6678, 0.6634, 0.6602, 0.6528 Resistance: 0.6737, 0.6754, 0.6775, 0.6877 |
EUR/USD | Support: 1.0901, 1.0848, 1.0815, 1.0774 Resistance: 1.0998, 1.1030, 1.1107, 1.1150 |
GBP/USD | Support: 1.2725, 1.2686, 1.2651, 1.2616 Resistance: 1.2786, 1.2881, 1.2905, 1.2966 |
USD/JPY | Support: 144.32, 143.31, 142.86, 142.22 Resistance: 144.96, 145.59, 146.75, 147.50 |
AUD/JPY | Support: 96.83, 96.67, 95.85, 95.61 Resistance: 97.17, 97.45, 97.62, 98.07 |
EUR/JPY | Support: 158.10, 157.77, 156.73, 156.17 Resistance: 158.91, 159.54, 160.04, 160.43 |
USD/CAD | Support 1.3386, 1.3320, 1.3292, 1.3258 Resistance: 1.3442, 1.3482, 1.3518, 1.3553 |
USD/CHF | Support 0.8487, 0.8464, 0.8449, 0.8435 Resistance: 0.8571, 0.8593, 0.8651, 0.8677 |
Key Support and Resistance Levels
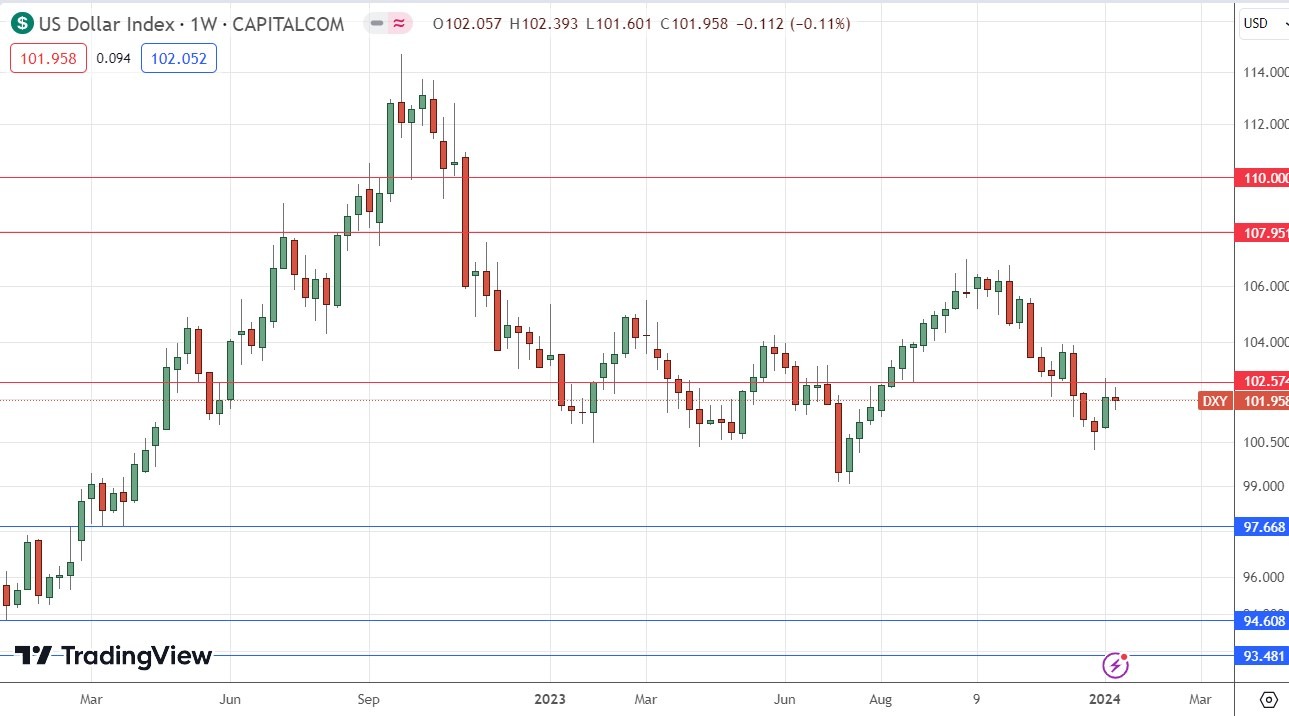
The US Dollar Index printed a doji candlestick last week, which did not give any notable directional indicator. The weekly close was down on the price of 3 months ago but up on the price of 6 months ago, presenting a mixed long-term trend.
It should be noted there are several bearish factors:
- The weekly candlestick has a significant upper wick.
- The upper wick of the weekly candlestick looks to have again rejected a new key resistance level at 102.57, with all the price action taking place below that level.
- Recent price action has invalidated the former key support level at 101.56.
For these reasons, I am prepared to be short of the US Dollar, but as it is still January, direction in markets can be very hard to predict, so I am cautious.
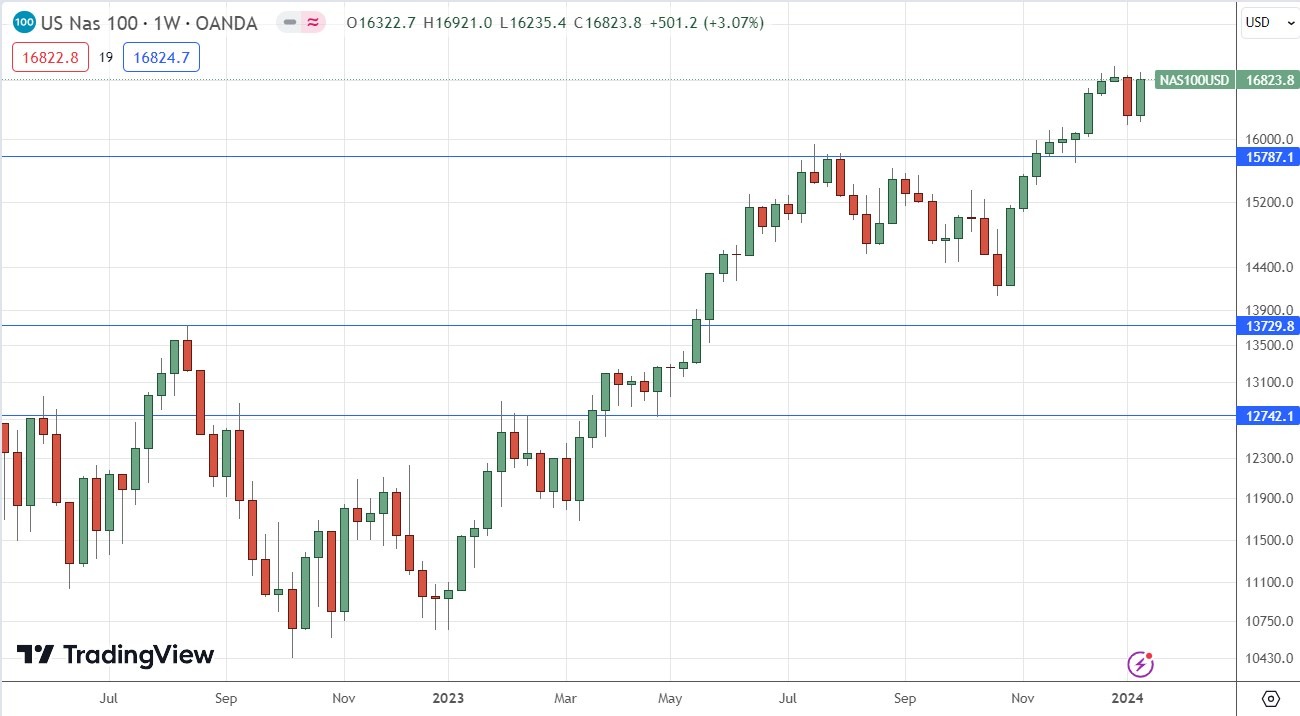
After falling quite firmly last week, the NASDAQ 100 Index bounced back strongly at the end of the week following lower than expected US PPI data which will improve expectations of rate cuts in the USA. This was evidenced by the US 2-year treasury yield closing the week at a multi-month low. The same sentiment pushed up stocks, especially in the USA, and as usual in times of risk-on sentiment, tech stocks were the big winner.
This may give bulls renewed confidence, especially looking at how much this Index has risen over the past year, which shows just how strong this trend really is. However, it is worth noting that the price is now not far from the all-time high made very recently just below 17000. The price closing near last week’s high is a sign of bullish momentum, but it remains to be seen whether it carries through. Fed member Goolsbee, who is known for being a monetary hawk has been trying to talk down the impact of the PPI data last Friday, so when the market opens later, we will see whether it focuses more on his words or the lower PPI reading itself.
I think it is still wise to look for long trade entries here, ideally on a bullish breakout which I would see evidenced as a daily close above the all-time high at 17000.
Long-term conditions remain supportive of the bull market.
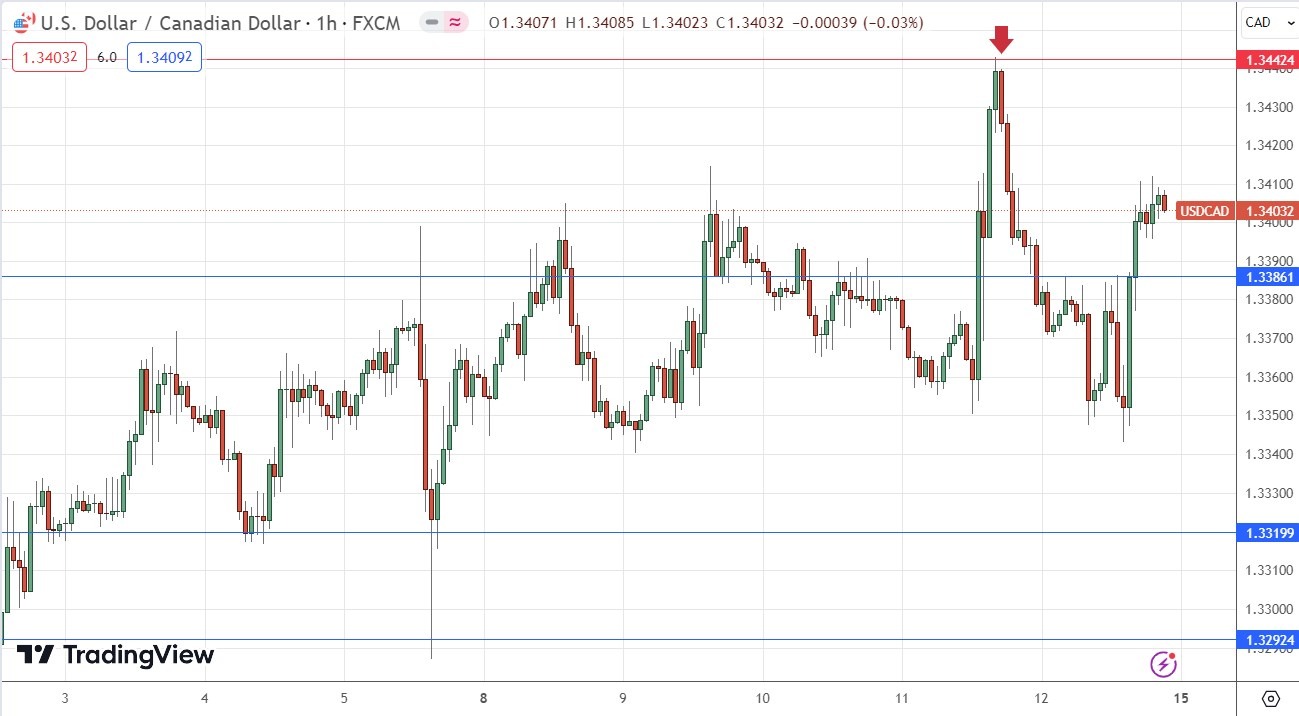
I had expected the level at $1.3442 might act as resistance in the USD/CAD currency pair last week, as it had acted previously as both support and resistance. Note how these “role reversal” levels can work well. The H1 price chart below shows how the price rejected this level just before the close of last Thursday’s London session with an engulfing candlestick, marked by the down arrow in the price chart below signaling the timing of this bearish rejection. This took place during the London / New York session overlap which can be a great time of day to trade Forex. This trade was nicely profitable, giving a maximum reward to risk ratio of more than 3 to 1 based upon the size of the entry candlestick structure.
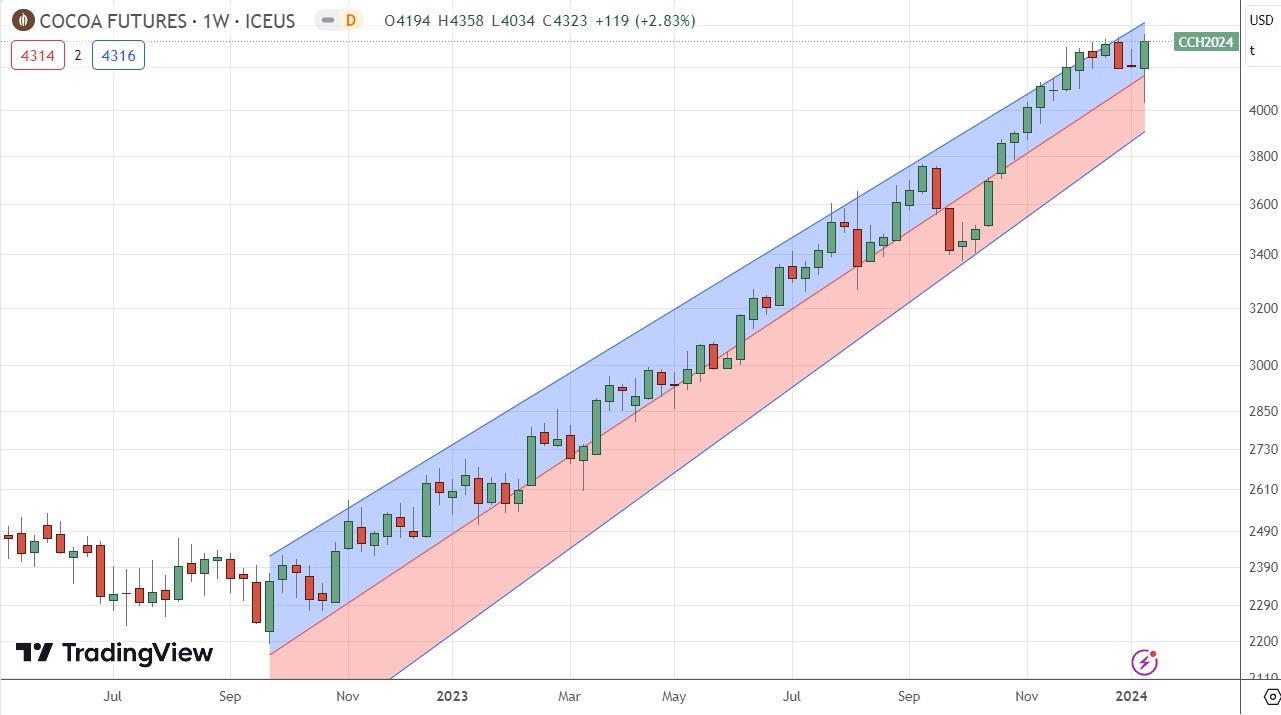
Cocoa futures have been in a strong bullish trend for over a year and last week the price again advanced last week after initially making a sharp drop to again reach a new multi-year high price. The price chart below applies linear regression analysis to the past 68 weeks and shows graphically what a great opportunity this has been on the long side.
The weekly candlestick was a true bullish engulfing candlestick which closed near its high, at a multi-year high closing price.
Despite the recent sharp dip, this strong trend shows no true sign of stopping. There is an ever-increasing global demand for the superfood cocoa and supply has been stretched over recent months.
Trading commodities long on breakouts to new 6-month highs has been a very profitable strategy over recent years.
Forex Brokers We Recommend in Your Region
See full brokers listI see the best trading opportunities this week as:
- Long of the EUR/USD currency pair following a daily close above $1.1000.
- Long of the NASDAQ 100 Index following a daily close above 17000.
- Long of Cocoa Futures.
Ready to trade our weekly Forex forecast? Here are the best Forex brokers to choose from.
https://news.google.com/rss/articles/CBMibGh0dHBzOi8vd3d3LmRhaWx5Zm9yZXguY29tL2ZvcmV4LXRlY2huaWNhbC1hbmFseXNpcy8yMDI0LzAxL3dlZWtseS1mb3JlY2FzdC1vZi1tYWpvci1tYXJrZXRzLTE0MDEyMDI0LzIwNjM5MNIBAA?oc=5
2024-01-14 12:27:21Z
CBMibGh0dHBzOi8vd3d3LmRhaWx5Zm9yZXguY29tL2ZvcmV4LXRlY2huaWNhbC1hbmFseXNpcy8yMDI0LzAxL3dlZWtseS1mb3JlY2FzdC1vZi1tYWpvci1tYXJrZXRzLTE0MDEyMDI0LzIwNjM5MNIBAA
Bagikan Berita Ini


0 Response to "Weekly Forecast of Major Markets - Forecast 01/14 (Graph) - DailyForex.com"
Post a Comment