Getting to know the Paint Bar Forex strategy
 By Dmitriy Gurkovskiy, Chief Analyst at RoboForex
This article provides a free overview of Paint Bar Forex, and the indicators of the strategy only cost $2,667. It suits Forex, futures, and stocks market, timeframes from M1 to MN with the only difference: requirements to trading signals on minute timeframes are stricter than to signals on larger timeframes because the general idea is that the smaller the timeframe, the faultier become the signals, and vice versa. However, one thing occurred to me while I was writing this: the smaller the timeframe, the less time the trader has to make a decision, so they suffer harder stress. Hence, even if the forex strategy works well on small timeframes, the trader tends to make more mistakes. Or, at least, this idea is fair for me.
Paint Bar Forex desktop
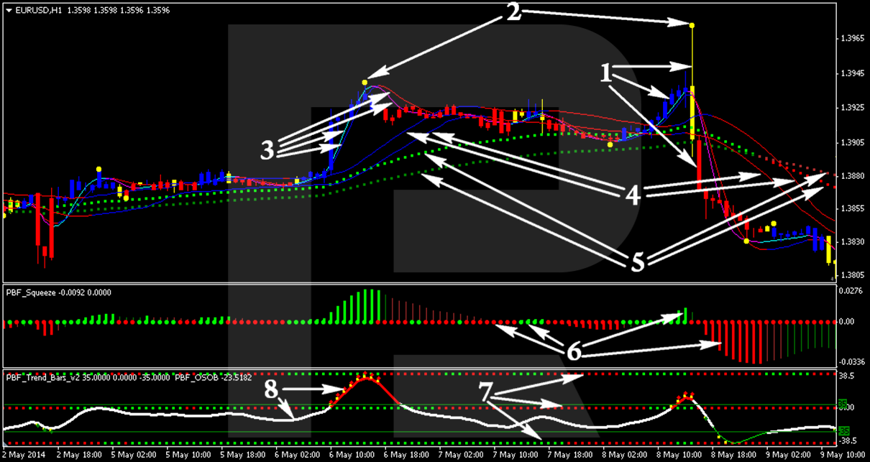
Desktop explications:
- candlestick colored by the PBF_PB_Direction indicators
- yellow dots from the PBF_Scalper_Show_Me indicator
- the PBF_Fast_3MAs indicator
- the PBF_iTunnel indicator
- the PBF_2EMA_Color indicator
- the PBF_Squeeze indicator
- the PBF_Trend_Bars_v2 indicator
- the PBF_OSOB indicator
Trend signal to buy by Paint Bar Forex
The signal appears when the following signals of the indicators coincide:
- under the chart, a yellow dot from PBF_Scalper_Show_Me appears or just a clear local low forms;
- PBF_2EMA_Color must be green (not necessary for H1 and larger charts);
- PBF_iTunnel must be blue (not necessary for H1 and larger charts);
- the histogram and the dot at the zero level from PBF_Squeeze must be green;
- all the three rows of dots of PBF_Trend_Bars_v2 must be green (not necessary for H1 and larger charts);
- PBF_OSOB value must be 35 or lower (when it rises higher, the color of the indicator changes from white to red);
- the blue candlestick must close above both lines of PBF_Fast_3MAs.
Example of a signal to buy
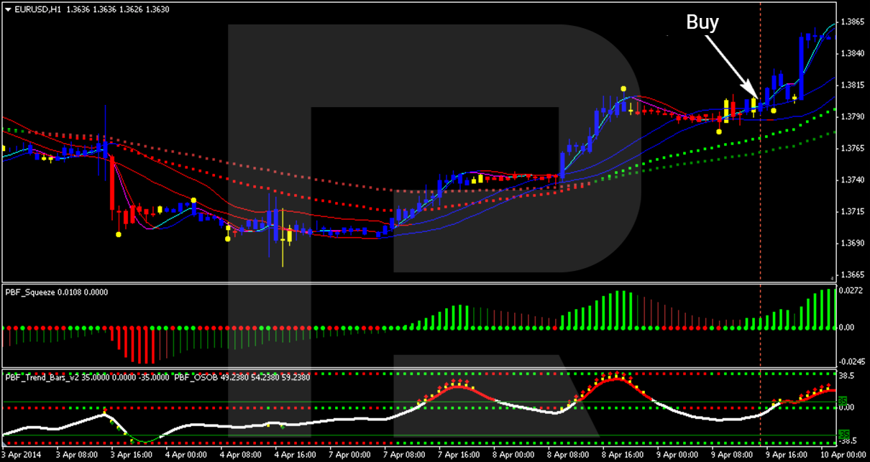
Regardless of the H1 timeframe, all
conditions for entering a long position were fulfilled.
Counter-trend signal to buy by Paint Bar Forex
This signal appears when there is a
divergence of the price chart and PBF_Squeeze. As soon as a lower bottom
appears on the chart, resulting in a local low (or a yellow PBF_Scalper_Show_Me
dot under the chart), while the indicator forms a higher top than previously -
you may enter a long position.
Example of a counter-trend signal by the strategy
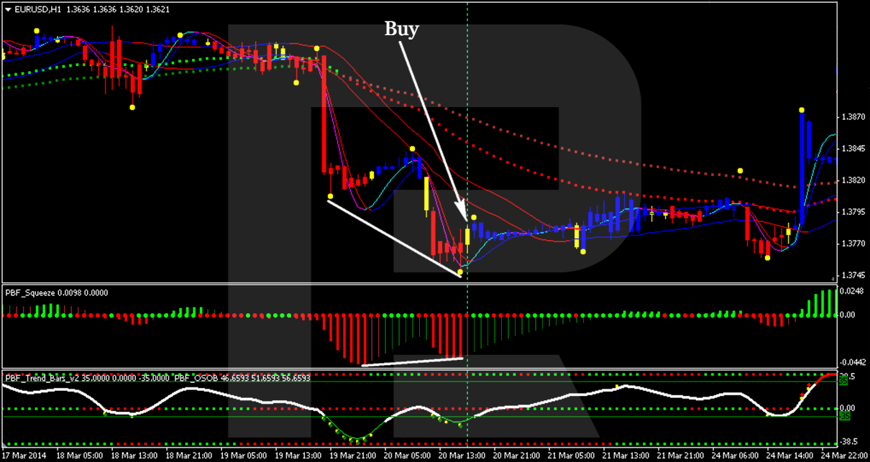
An entry signal appeared after local lows
on the chart and the indicator were complete.
Trend signal to sell by Paint Bar Forex
It appears when the following signals from the indicators coincide:
- above the chart, a yellow dot from PBF_Scalper_Show_Me appears or just a clear local high forms;
- PBF_2EMA_Color must be red (not necessary for H1 and larger charts);
- PBF_iTunnel must be red (not necessary for H1 and larger charts);
- the histogram and the dot at the zero level from PBF_Squeeze must be red;
- all the three rows of dots of PBF_Trend_Bars_v2 must be red (not necessary for H1 and larger charts);
- PBF_OSOB value must be no lower than -35 (when it falls lower, the color of the indicator changes from white to green);
- the red candlestick must close below both lines of PBF_Fast_3MAs.
Example of a signal to sell by Paint Bar Forex
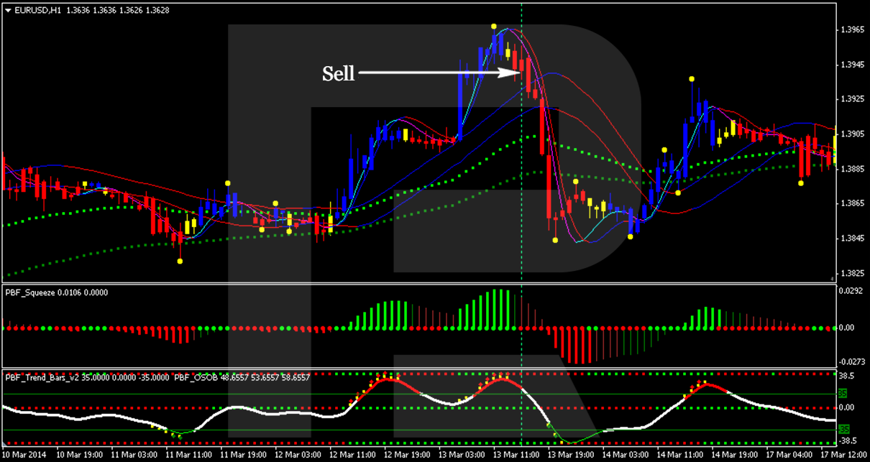
In this example, however, only those
conditions are fulfilled that are obligatory for H1 and larger.
Counter-trend signal to sell by Paint Bar Forex
This signal appears after a divergence of
the price chart and PBF_Squeeze. As soon as the price chart creates a higher
top with a local high (or a yellow dot of PBF_Scalper_Show_Me above the chart),
while the indicator forms a top lower than the previous one - you may enter a
short position.
Example of a counter-trend signal to sell by Paint Bar Forex
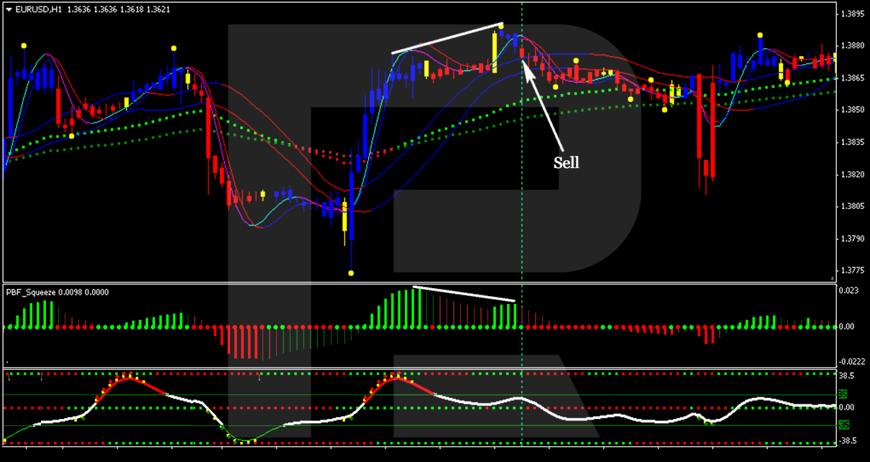
A signal to sell by the strategy appeared
right after local highs formed on the price chart and on PBF_Squeeze. Note that
PBF_OSOB also diverged with the price chart. When this happens, this makes the
signal even stronger.
Stop Loss and Take Profit in the strategy
Stop Loss is placed either behind the yellow dot of PBF_Scalper_Show_Me or behind the last local extreme, if the yellow dot is too far from the entry level.
You can start trailing the position when one of the following events happens:
- PBF_OSOB grew to 35 in case of buying or falls under -35 in case of selling;
- on PBF_Squeeze, a histogram or a dot appears at zero, of the opposite color to the color of the signal;
- on PBF_Scalper_Show_Me, a yellow dot appears above the price chart in case of buying or below it in case of falling.
As soon as one of the events happens, the Stop Loss is transferred under (when buying) or above (when selling) both lines of PBF_iTunnel. As soon as two events happen, move the SL under the highest (when buying) or above the lowest (when selling) line of PBF_iTunnel. When a condition for trailing the position emerges, the SL moves after each candlestick.
If during buying red dots started forming above PBF_OSOB, or if during selling green dots start forming below it, this is considered enough for trailing the position behind the nearest PBF_iTunnel line to the price chart.
No Take Profit is suggested for trend indicators. For counter-trend signals, Take Profit is set at the level of the nearest PBF_2EMA_Color line. While indicator values are changing, Take Profit also changes until it is triggered.
Money management in Paint Bar Forex
The author of the strategy gives no clues to which method of money management you should use. As long as the trading signals require immediate reaction, it would be wiser to enter the position by a certain lot size. However, always remember to keep your risks within 1-2% of the deposit.
Example of trading by Paint Bar Forex
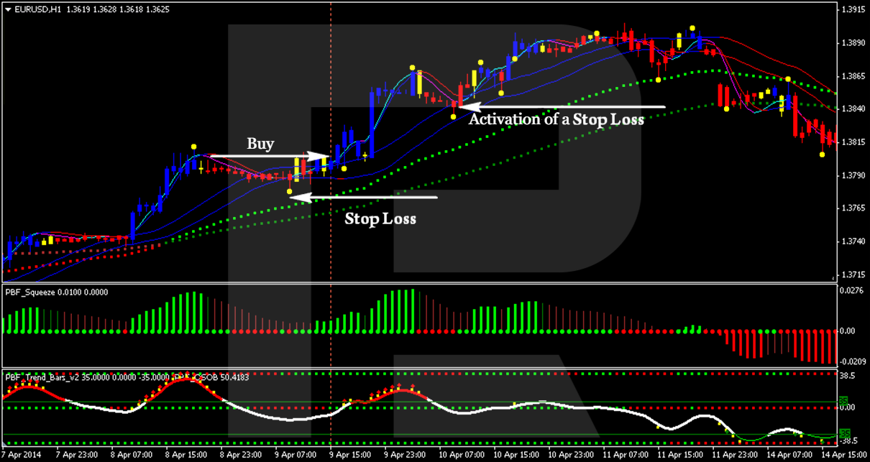
Avoid following trading signals when
indicators are intertwined and stick to zero, while the price is inside
PBF_iTunnel or PBF_2EMA_Color.
https://www.forexlive.com/Education/!/how-to-trade-by-paint-bar-forex-strategy-20211202
2021-12-02 11:59:47Z
CBMiV2h0dHBzOi8vd3d3LmZvcmV4bGl2ZS5jb20vRWR1Y2F0aW9uLyEvaG93LXRvLXRyYWRlLWJ5LXBhaW50LWJhci1mb3JleC1zdHJhdGVneS0yMDIxMTIwMtIBAA
Bagikan Berita Ini


0 Response to "How to trade by Paint Bar Forex strategy - ForexLive"
Post a Comment